What Is Geo Insights?
Geo Insights is a map-based analytics dashboard that combines your Google Ads performance, 12 months of sales history, demographic data, and competitive intelligence into one view. It shows you where your marketing is working, where it's not, and where opportunities are hiding.
The Core Market Problem (And How We Solve It)
Most geographic targeting starts with an assumption: pick a radius that feels right, draw a circle, and call it a day. But that's not how customers actually behave.
Urban dealerships surrounded by competitors might only draw efficiently from 25 miles. Rural stores with less competition often pull buyers from 50+ miles out. A fixed radius ignores all of that.
Geo Insights calculates your Core Market from your actual sales data.
Here's how:
- We establish your baseline conversion rate — How many households within 15 miles become customers? (We use U.S. Census data for household counts.)
- We find where performance drops off — We analyze expanding rings around your store, comparing actual sales to expected sales based on population. When conversion rates consistently fall below your baseline, we've found your boundary.
- We ensure the median customer is captured — As a floor, your Core Market always includes at least 50% of your actual sales.
The key: we normalize by population opportunity, not raw geography. A rural area with sparse population but strong conversion rates stays in your core. A dense suburb where you're losing to competitors gets flagged as outside your efficient reach.
This means your Core Market is yours — calculated from where you actually win, not where someone assumed you should.
Beyond your Core Market, we identify:
- Edge Markets — Sales clusters that partially overlap your boundary. Opportunities to extend your reach.
- Expansion Markets — Clusters completely outside your core, like a pocket of customers in a different city. These deserve dedicated campaigns.
- Outside Markets — Sporadic sales beyond your natural reach. Often destination purchases that may not warrant sustained investment.
What You Can See
Interactive Performance Map
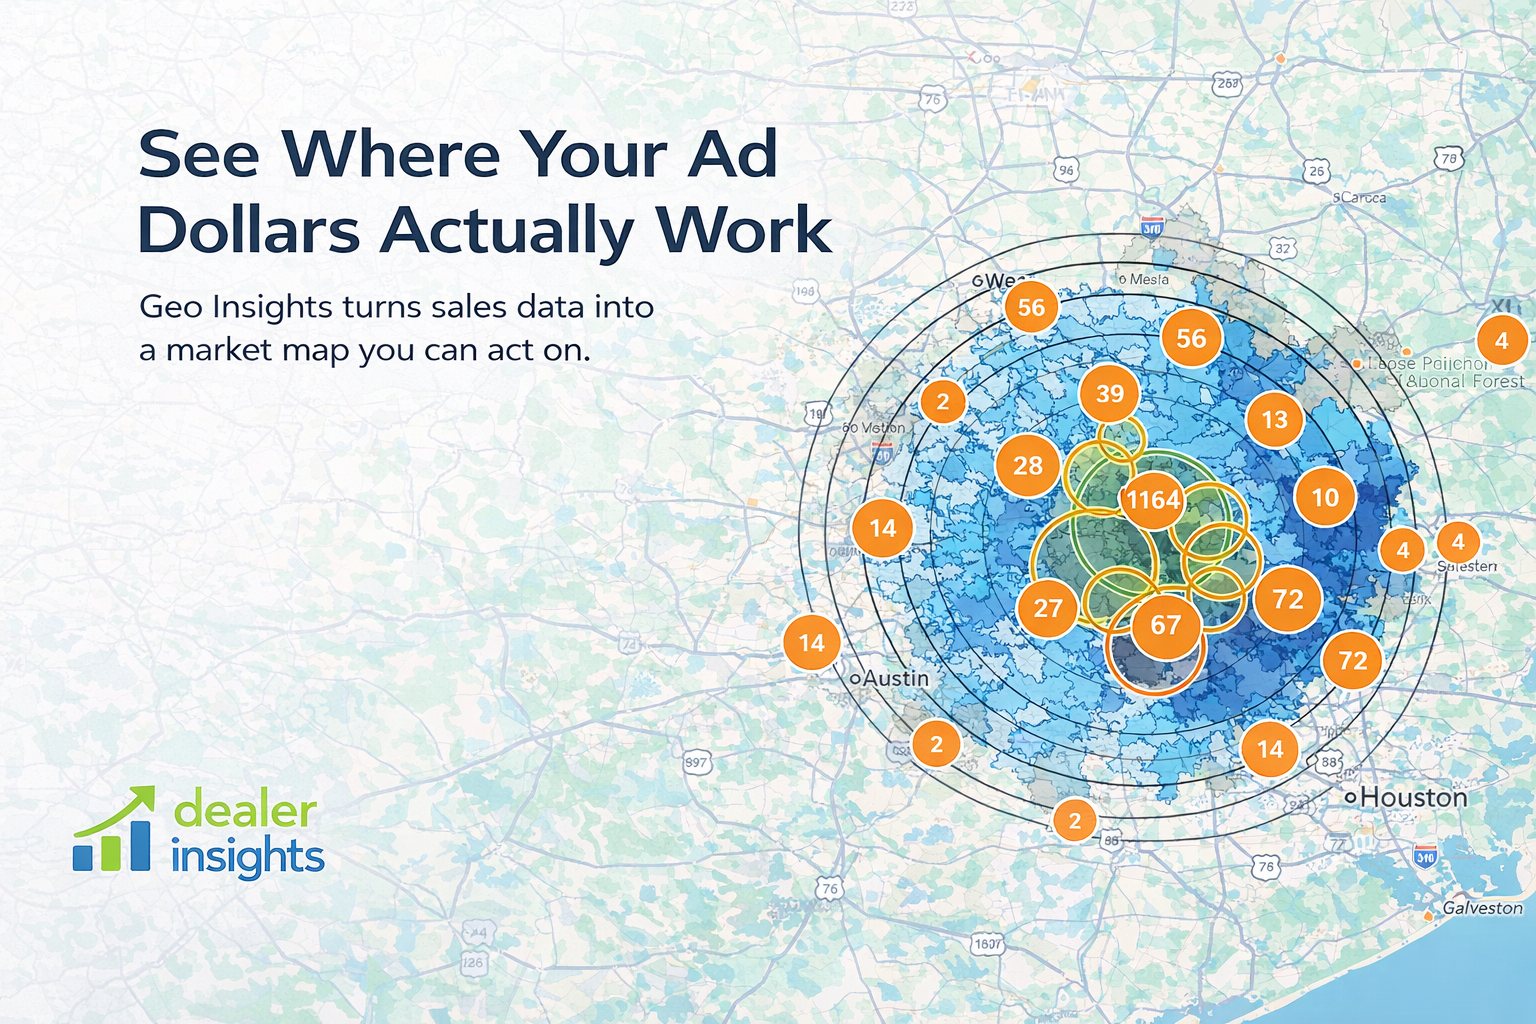
The heart of Geo Insights is a map that displays performance by ZIP code with color-coded overlays. At a glance, you'll see where impressions, clicks, cost-per-sale, and sales volume are concentrated.
You can also see:
- Individual sale locations with smart clustering
- Your campaign targeting areas (radius and location-based)
- Competitor locations
- Distance rings showing 10-mile increments from your store
Blue gradients show ad performance intensity. Green gradients reveal demographic concentrations. Multiple lenses, one map.
Market Reach Analysis
How does performance change with distance? The Market Reach breakdown shows you exactly what's happening in each distance band (0-10 miles, 10-20 miles, and so on):
- Total sales and percentage of overall volume
- Ad impressions and clicks
- Total spend and cost per sale
- Customer defections to competitors
The cumulative sales curve shows where your sales trail off—your 50th, 75th, and 90th percentile distances. If you're spending heavily in areas beyond your natural draw, you'll see it immediately.
Competitor Threat Intelligence
Knowing where you're winning is half the battle. You also need to know where you're losing—and to whom.
The Competitor Threat Analysis shows:
- Total competitors in your market
- Defection counts from the past 90 days
- Top threats ranked by volume
- Geographic proximity of each competitor
Red markers show exactly where competitors are pulling your customers. Click any competitor to see their defection count and location.
AI-Powered Geo Recommendations
Stop guessing where to focus expansion efforts. The Recommended Store Geos feature uses ensemble machine learning—combining multiple clustering algorithms—to identify the most promising geographic opportunities.
Each recommendation includes:
- Cluster type (Expansion or Edge)
- Confidence score
- Sales volume within the cluster
- Average distance from your store
- Algorithm agreement (how many analytical approaches identified this opportunity)
You can filter recommendations by vehicle segment. Looking to expand your truck market? Filter by trucks. Growing CPO sales? Filter by used inventory. The recommendations adapt to your goals.
Model-Specific Campaign Targeting
This is where Geo Insights becomes a campaign-building tool.
Say you're launching an F-150 promotion. Filter your sales to show only F-150 purchases, then hit Find Targets. The system analyzes 12 months of data and identifies geographic clusters where that model has sold well.
You get:
- Market circles showing where buyers are concentrated
- Cluster centroids (center points) with recommended radii
- Confidence scores for each cluster
- Sales counts within each area
Why this matters: The centroids are designed for easy loading into Google Ads proximity targeting. Instead of guessing where to target your truck campaign, you get data-driven geos based on where you've actually sold trucks.
This works for any segment—CPO campaigns, specific trims, new model launches. The same machine learning that powers your Core Market analysis runs on your filtered segment.
Campaign Targeting Visualization
Want to see if your current Google Ads targeting actually covers the areas that matter? The Targeting Overlay shows:
- Proximity targeting circles from your campaigns
- Location target polygons (postal code, city, county-level)
- Toggle specific campaigns on and off
This often reveals gaps between where you're advertising and where your customers actually are.
Sales Layer with Vehicle Filtering
Visualize exactly where different vehicles are selling:
- Filter by condition (New vs. Used)
- Filter by make
- Filter by model
Orange markers show sale locations with smart clustering. When you apply filters, you see a live count of matches.
Sales Outside Targeting: Orange-highlighted areas show where customers are buying despite having no ad coverage. Organic opportunities that might deserve investment.
Demographic Intelligence
The Demographics Overlay provides census-level data to help tailor messaging and inventory strategy:
- Household composition — Population, households, vehicle ownership levels
- Income distribution — 16 brackets from under $10K to $200K+
- Age demographics — Six cohorts from under 18 to 65+
- Housing tenure — Owner vs. renter occupied
See how these factors correlate with your sales patterns.
AI Market Narratives
Data is useful. Plain-language insights are faster. The AI Market Insight feature generates:
- A headline summarizing your current situation
- A narrative explaining the "why" behind the numbers
- Hotspots (growth areas, shown in green)
- Cooling zones (declining areas, shown in blue)
Click any area to navigate directly to it on the map.
Spend Efficiency Trending
Is your marketing getting more or less efficient? The Cost/Sale Trend tracks efficiency across 30, 60, and 90-day windows.
Downward trend (green) = spending less to acquire each customer. Upward trend (amber/red) = acquisition costs rising. One metric that tells you if your geographic strategy is working.
Editable Market Boundaries
Geo Insights doesn't just analyze—it lets you plan. Edit Mode enables you to:
- Drag market centers to new locations
- Adjust radii
- Create new markets anywhere on the map
- Track all changes with full audit history
Every edit is saved with who made it, when, and why.
Getting Started
Geo Insights is available in BETA for qualifying dealerships. The platform analyzes 12 months of sales data combined with real-time Google Ads performance.
Ready to see where your money actually works? Contact your account representative to enable Geo Insights.
Geo Insights is part of the Dealer Insights platform.