Sample reports · Insights IQ

One dealership. One month. Every question answered.

Follow one real franchise store through August and September 2026, one question at a time, and see the report that came back each time. We removed the store's name. Every number is real. Click any report to see it full size.

Question 1 of 8

“How did last month go?”

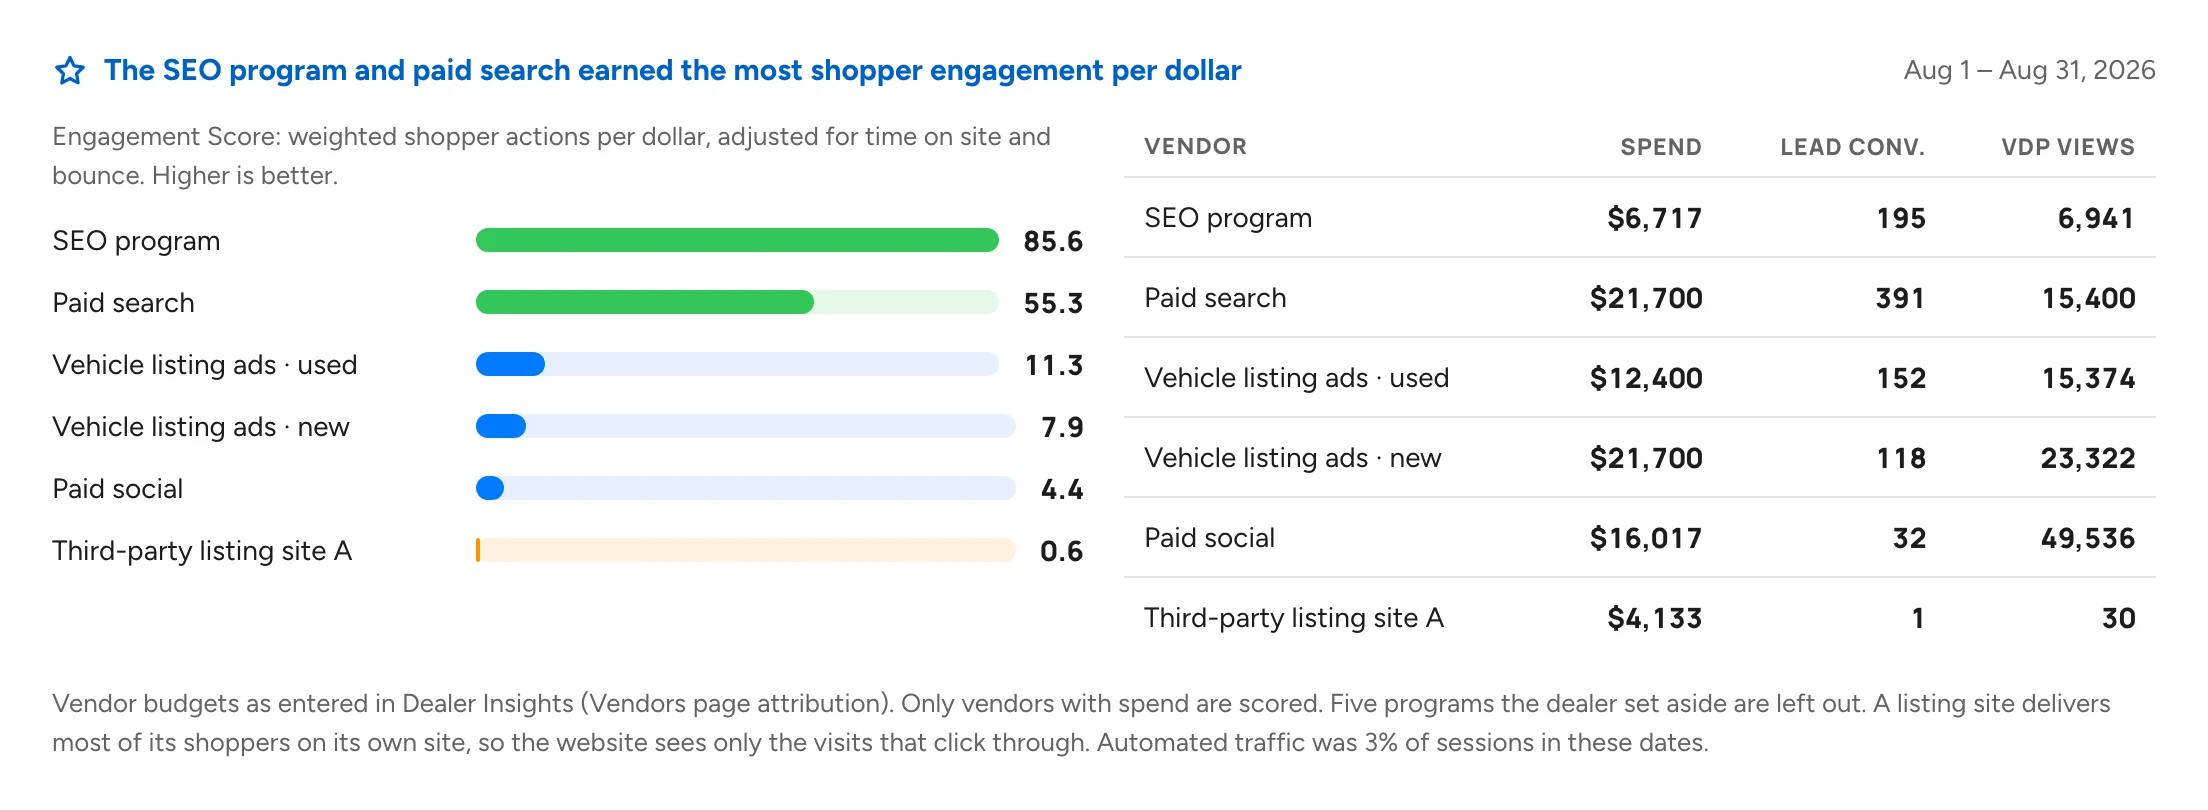
One page, six data sources: lead conversions, ad spend, sales calls, vehicle page views and how much of the traffic was real people. Then every vendor on one Engagement Score, so nobody grades their own homework.
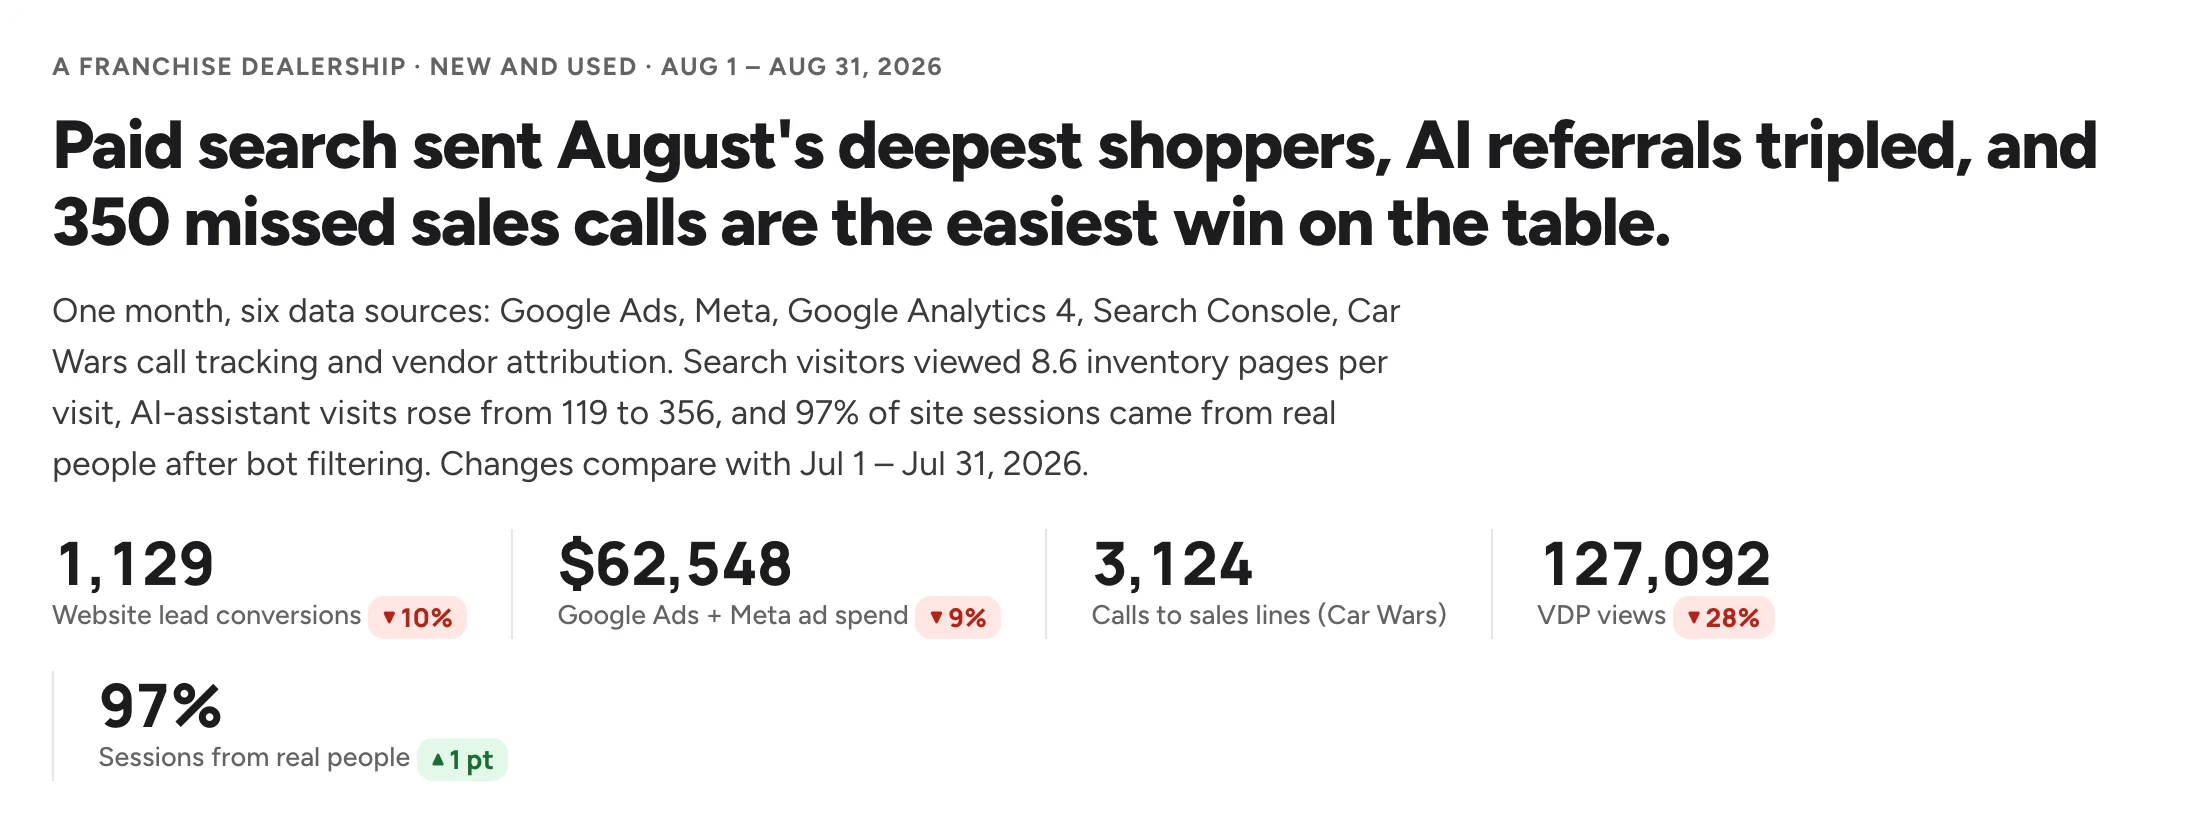
Monthly marketing review headline: lead conversions, ad spend, sales calls, VDP views and human traffic share
Vendor Engagement Score ranking with spend, lead conversions and VDP views

Question 2 of 8

“Where is the ad money actually working?”

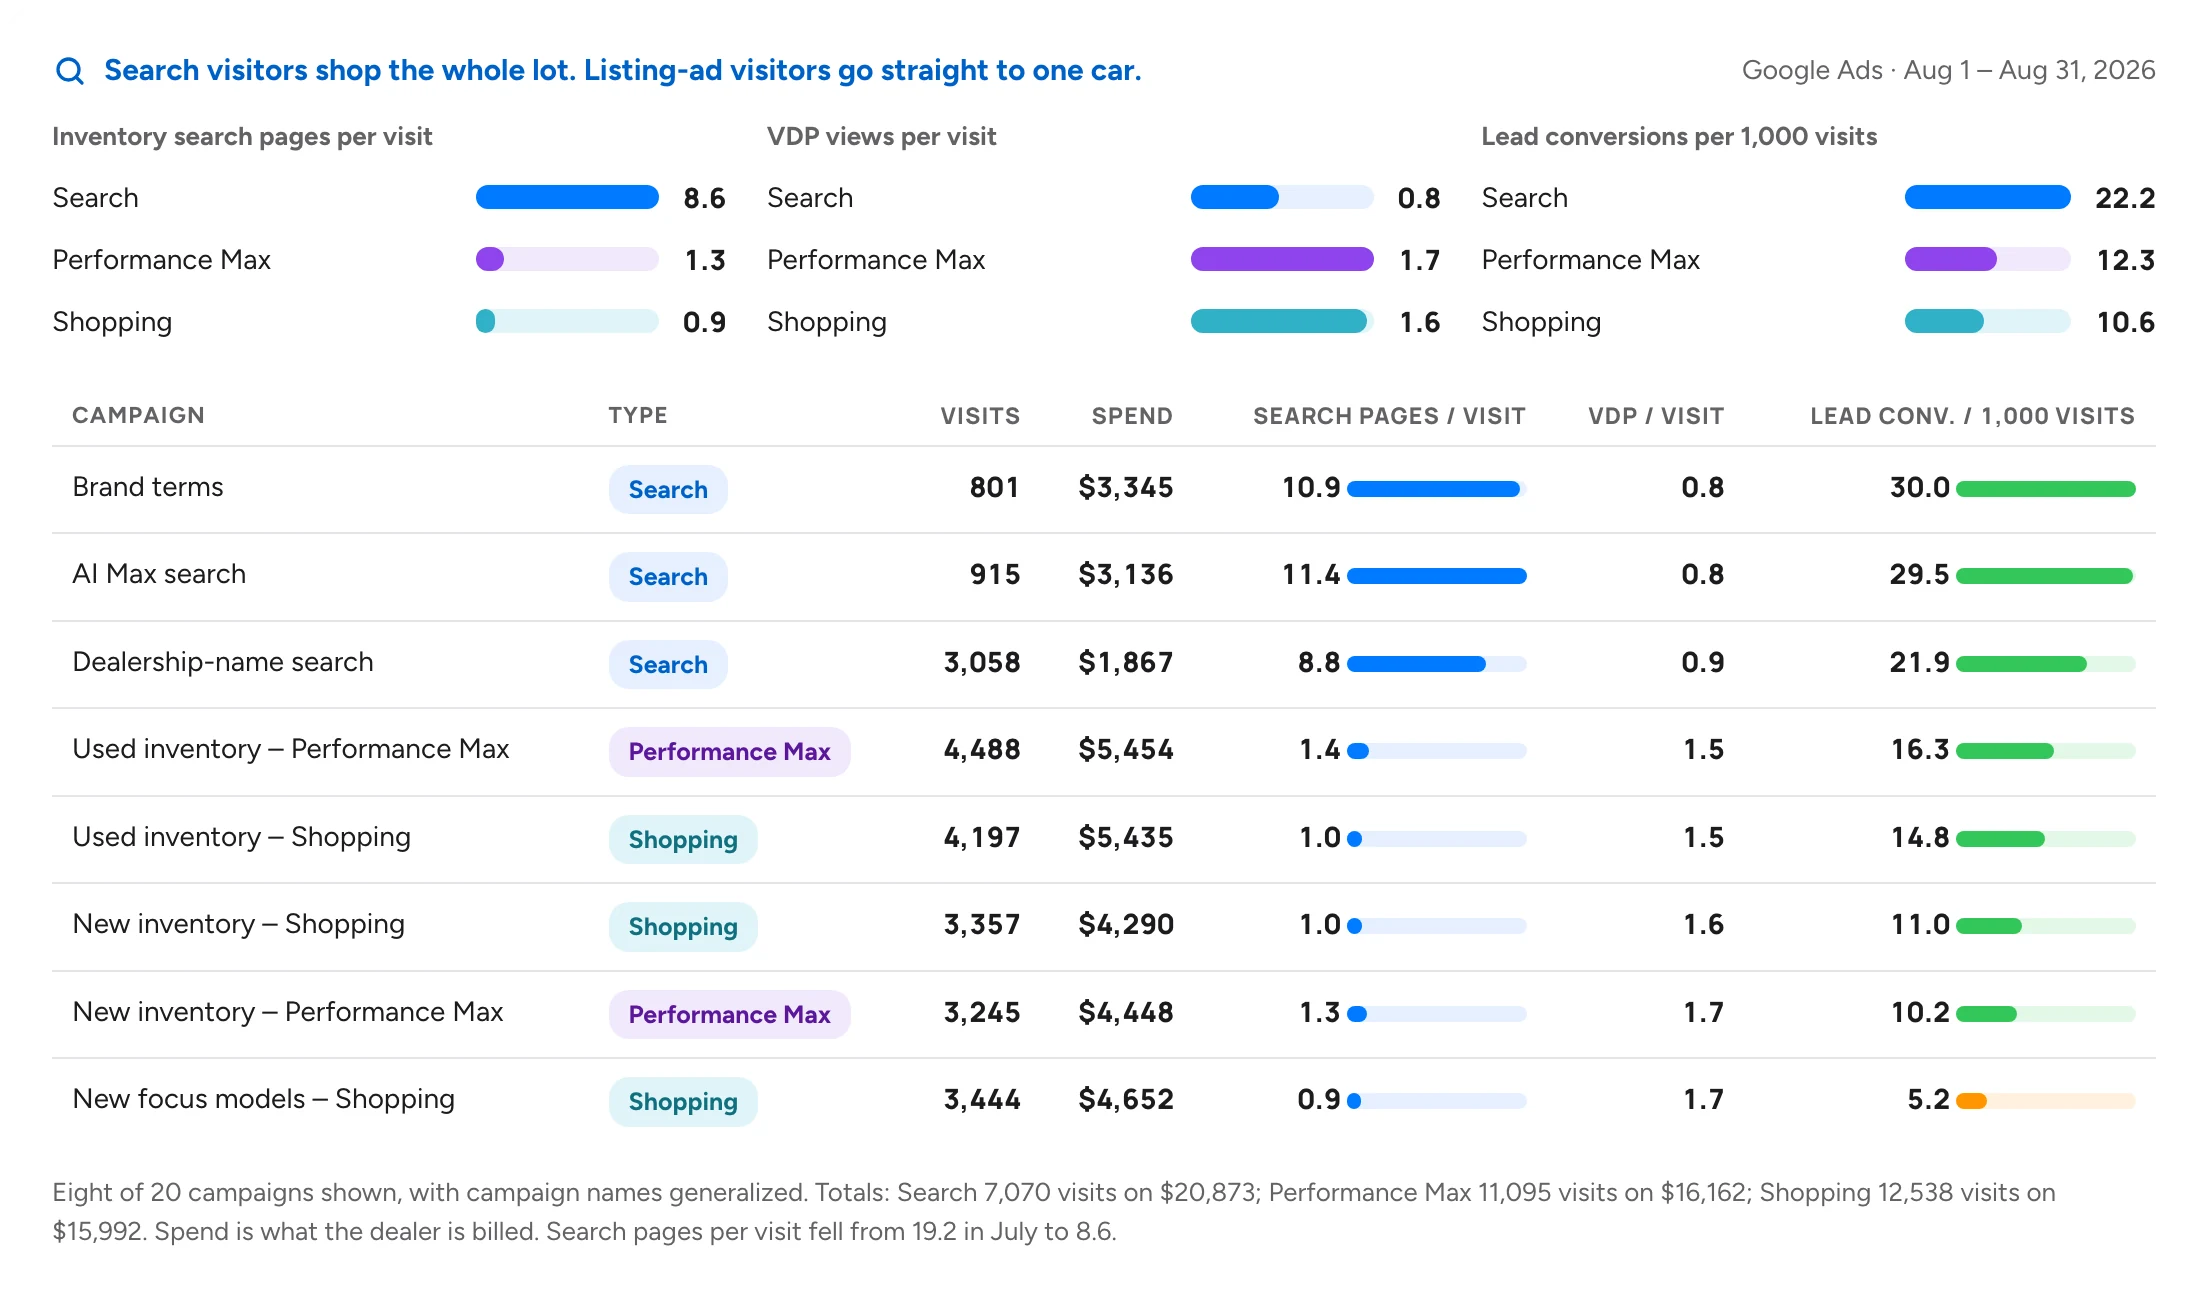
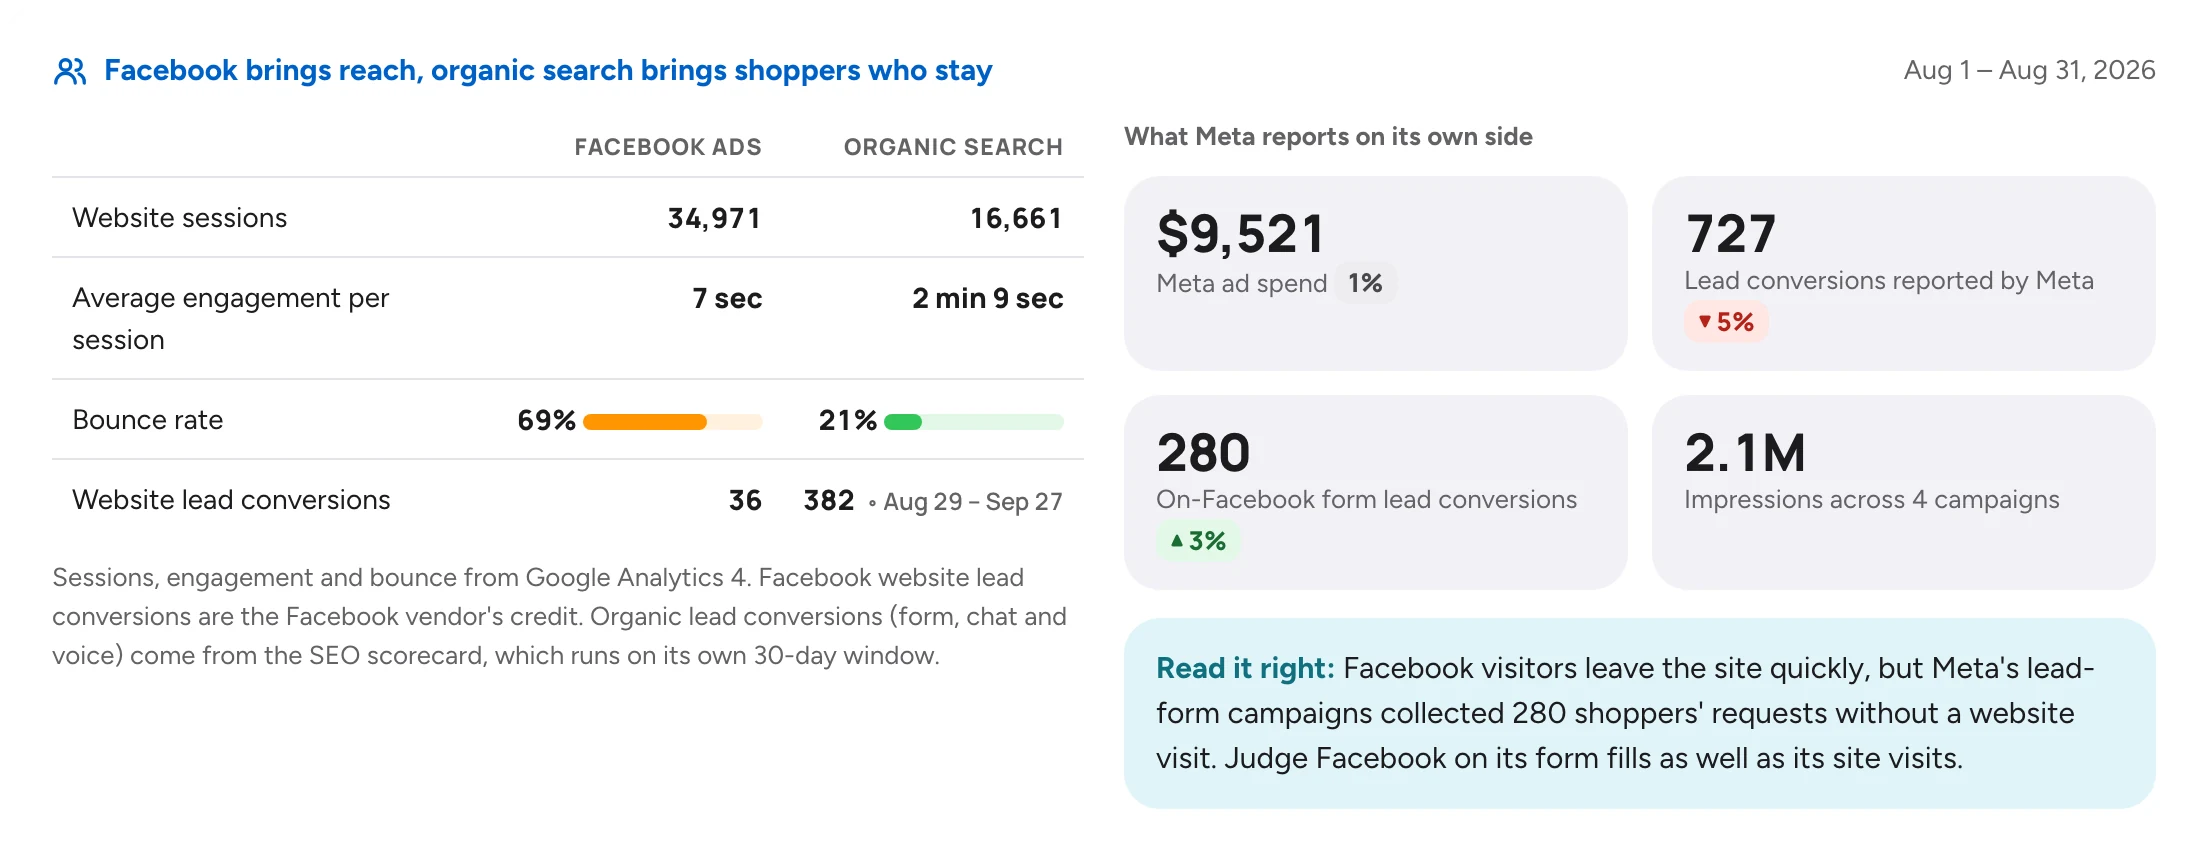
Not clicks. What shoppers did after the click, campaign by campaign. Then Facebook and organic search side by side, with what Meta counts on its own forms kept separate.

Search ads versus Performance Max and Shopping: what visitors did after the click, by campaign
Facebook ads versus organic search: sessions, engagement, bounce rate and lead conversions

Question 3 of 8

“Are we answering the phone?”

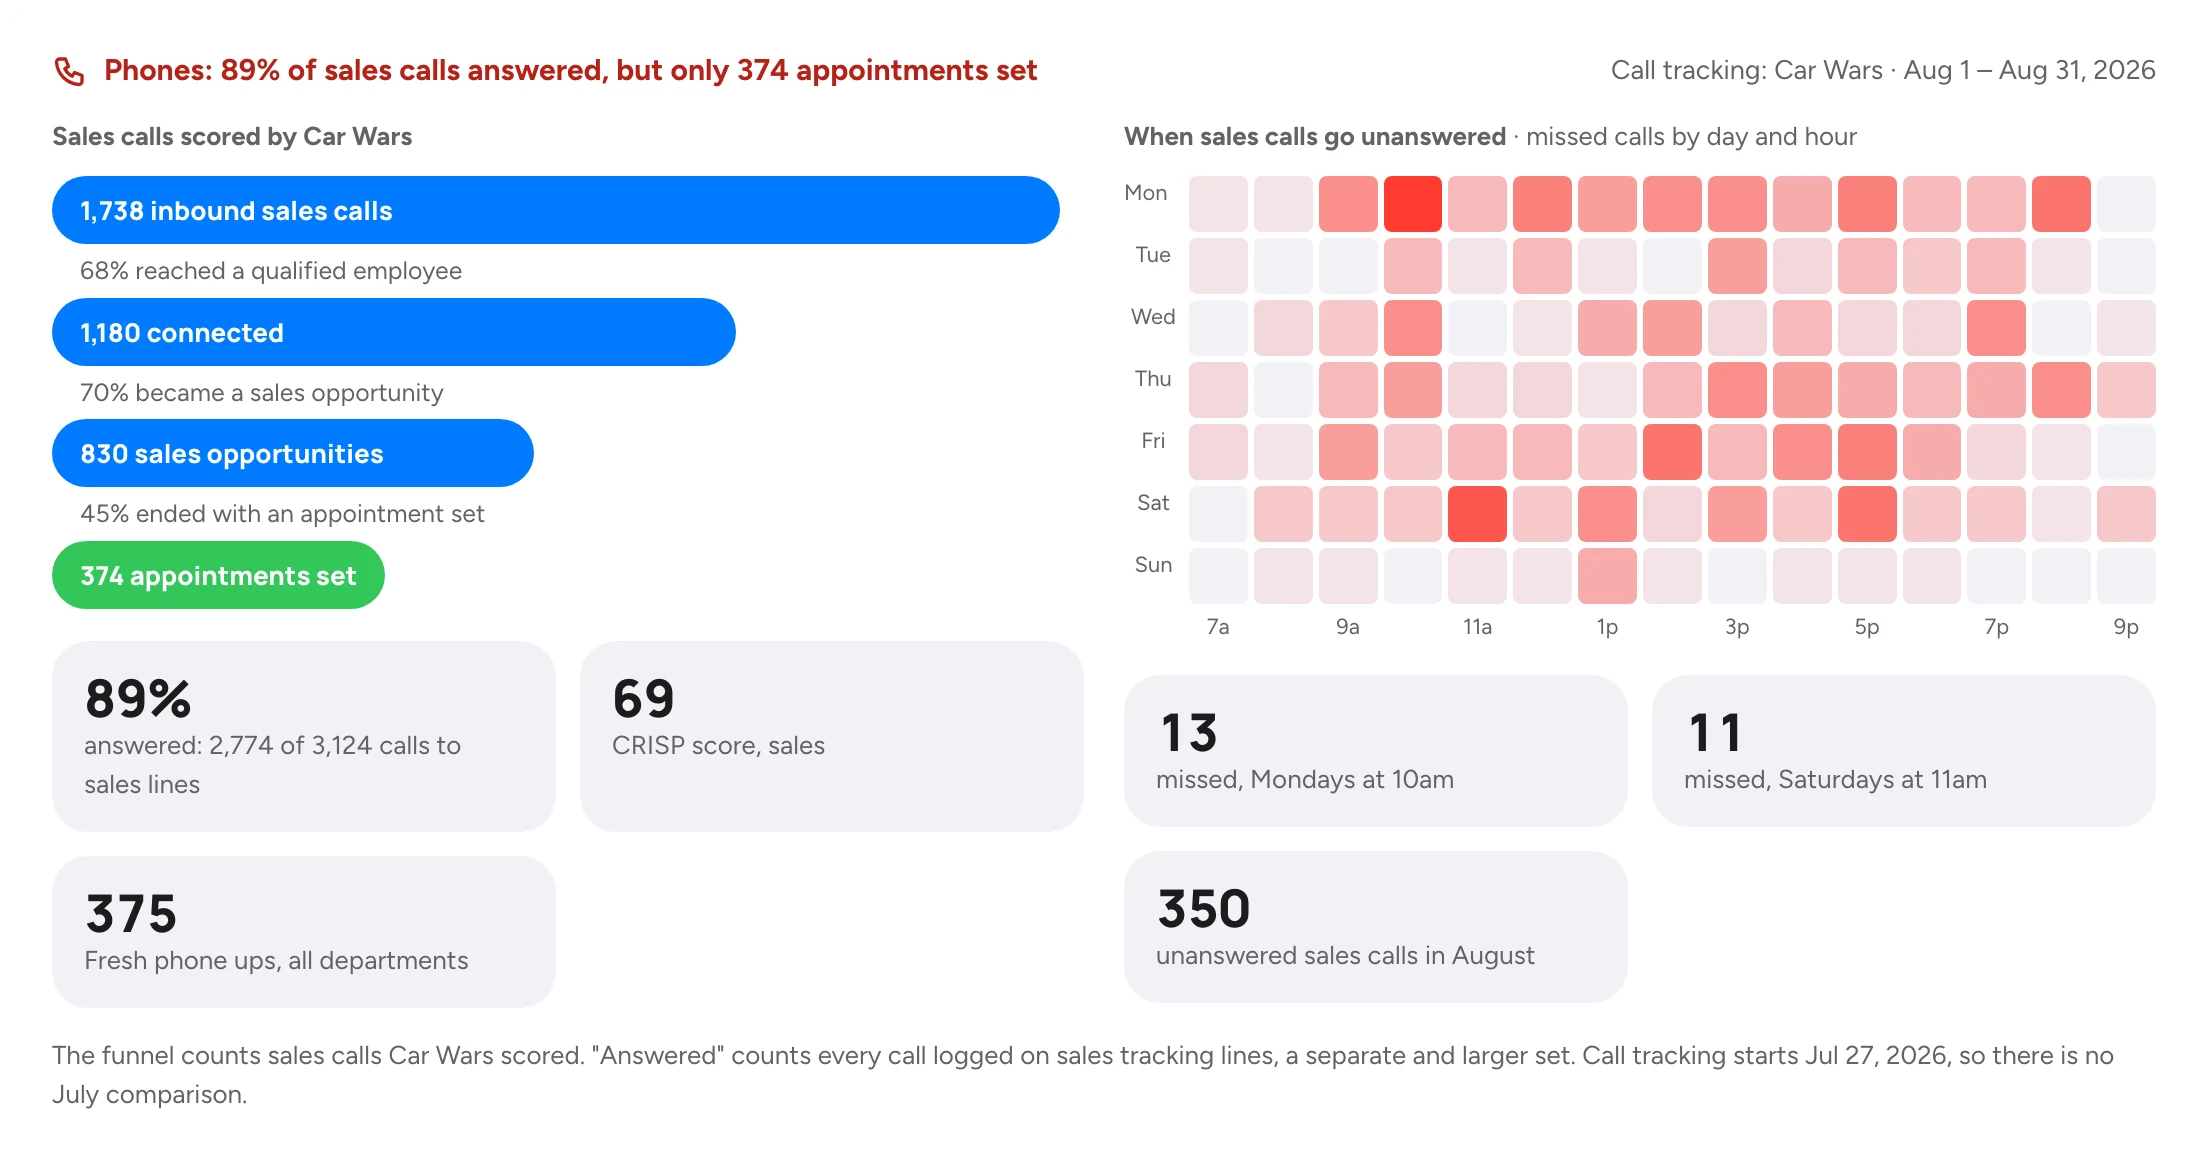
Car Wars call tracking from inbound sales call to appointment set, and a heat map of exactly when sales calls go unanswered.

Car Wars sales call funnel and heat map of missed sales calls by day and hour

Question 4 of 8

“Is the traffic real? Are we showing up?”

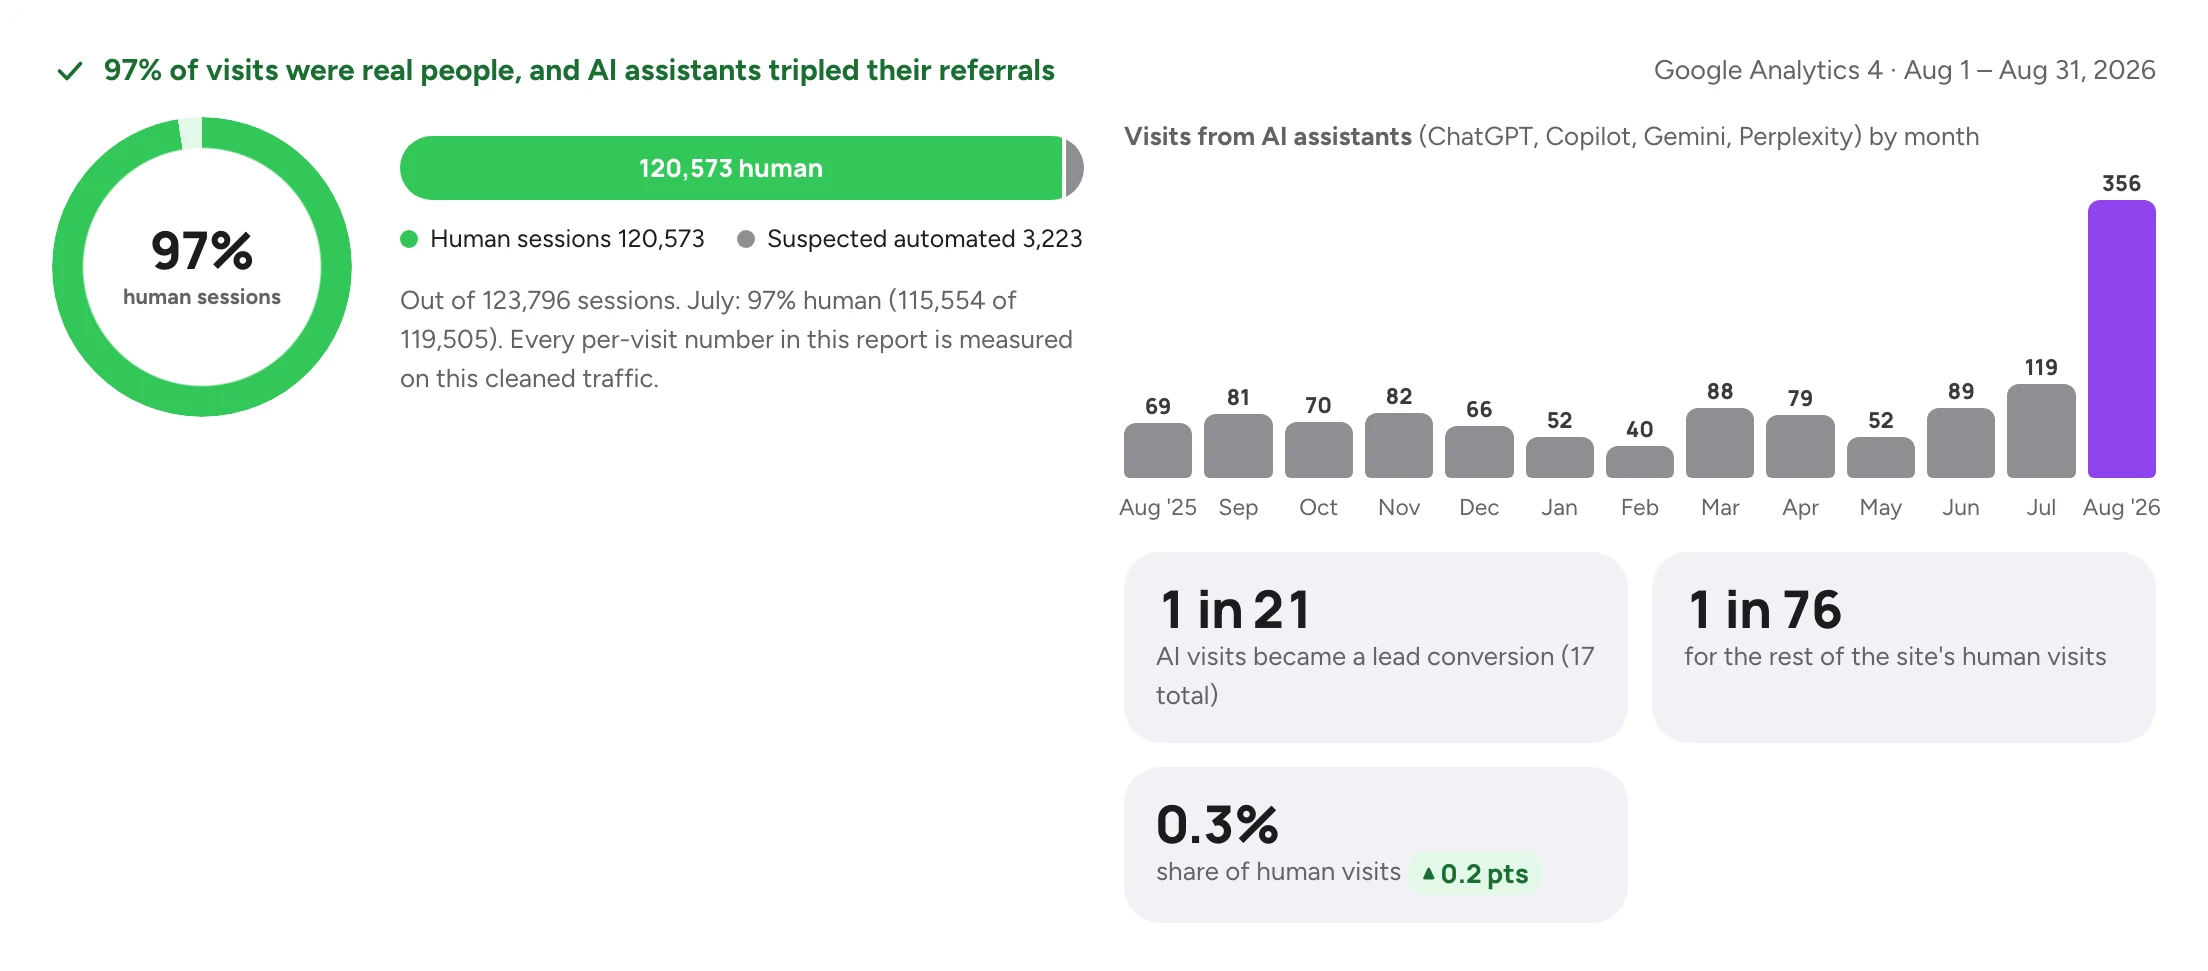
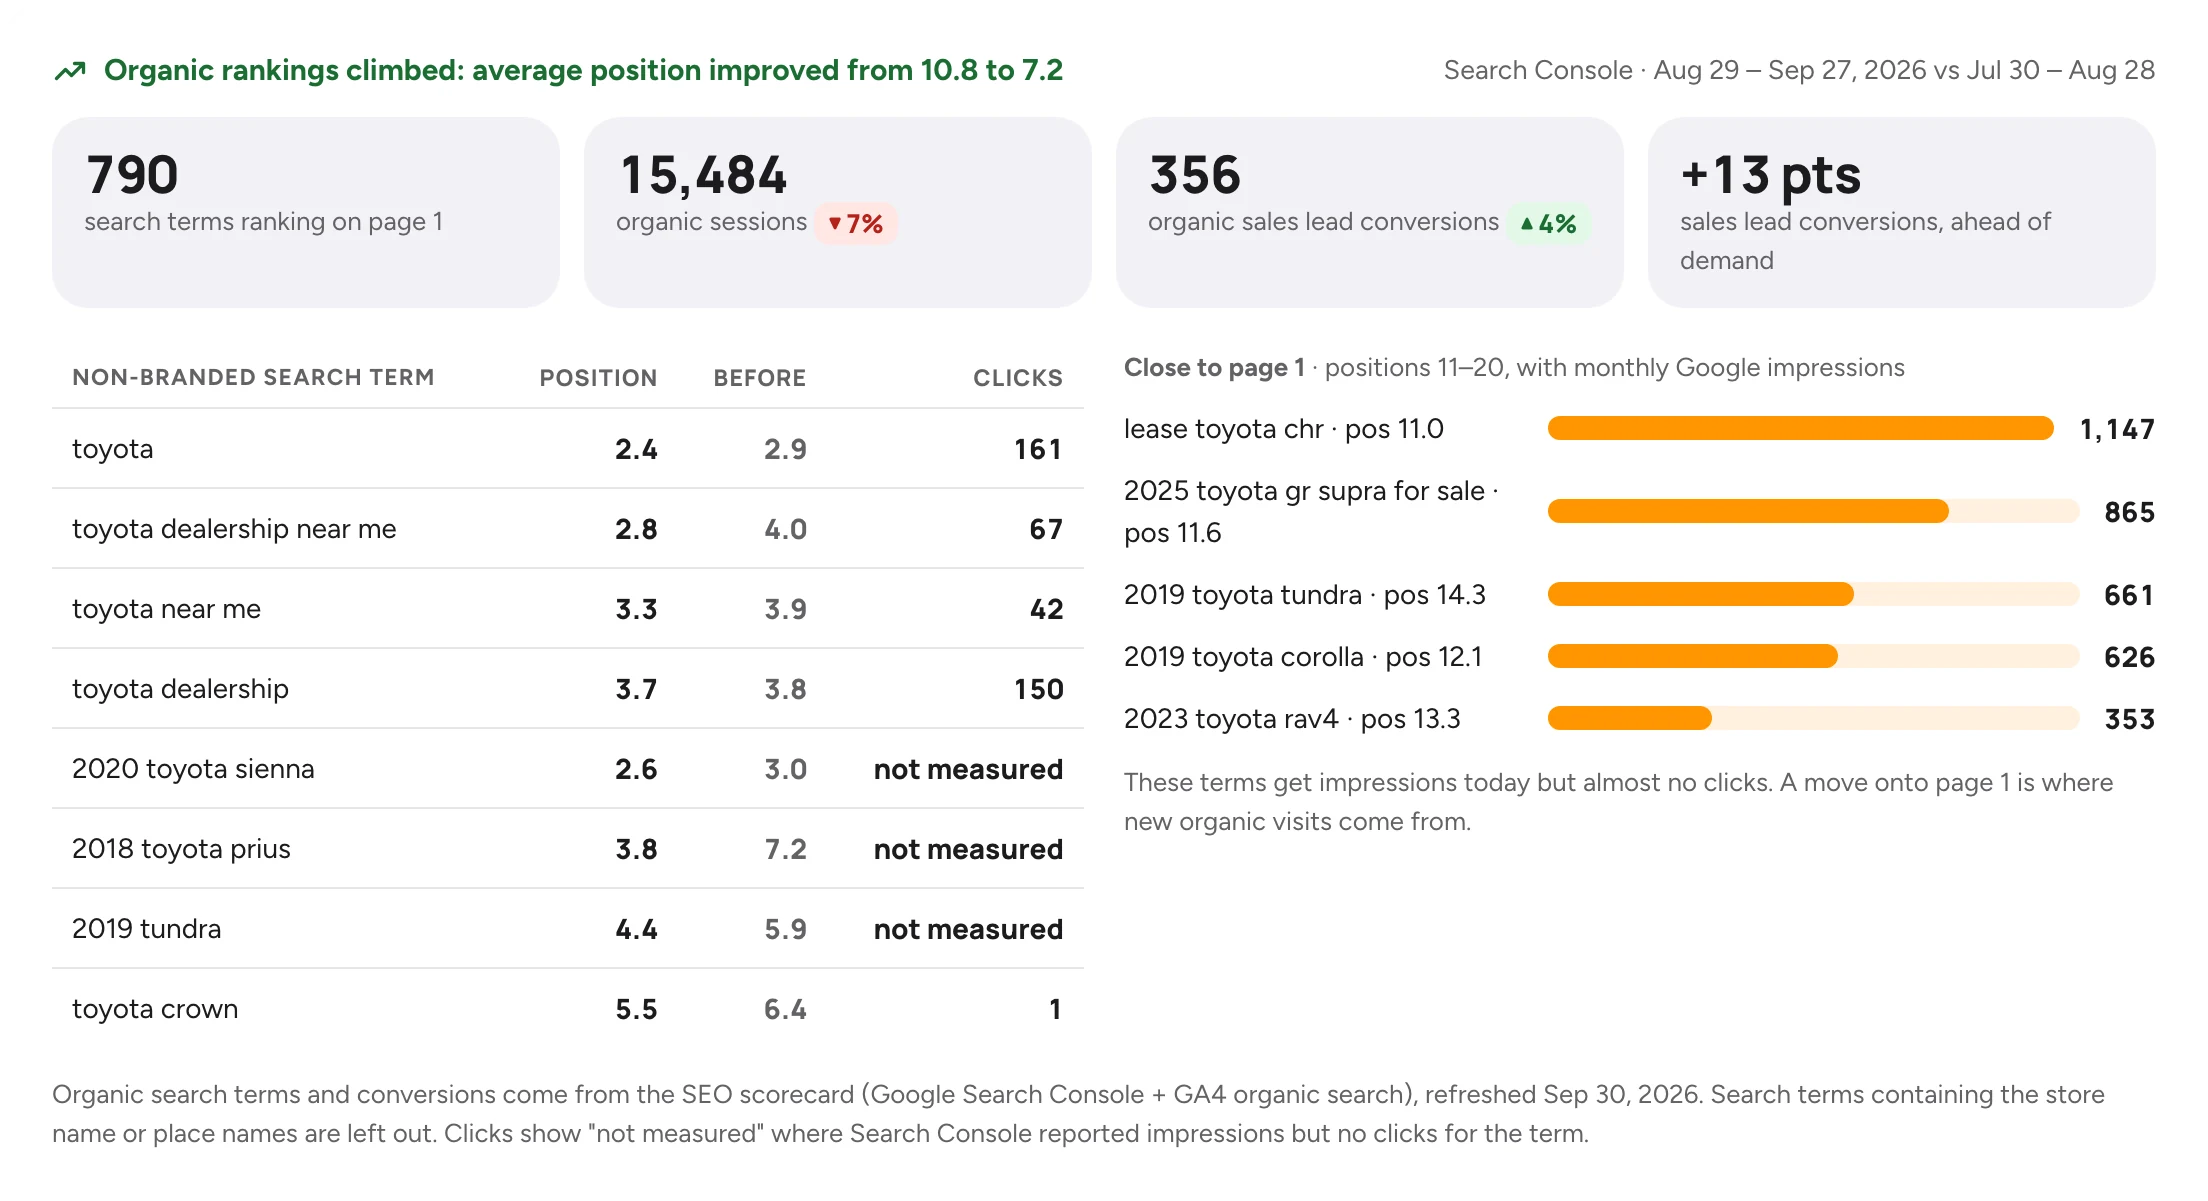
Bots set aside before anything is counted, visits from AI assistants like ChatGPT month by month, and the organic searches the store ranks for, including the ones one step from page one.

Human versus automated website sessions and monthly visits from AI assistants
Organic search rankings: positions, clicks and search terms close to page one

Question 5 of 8

“What do we do with every new model?”

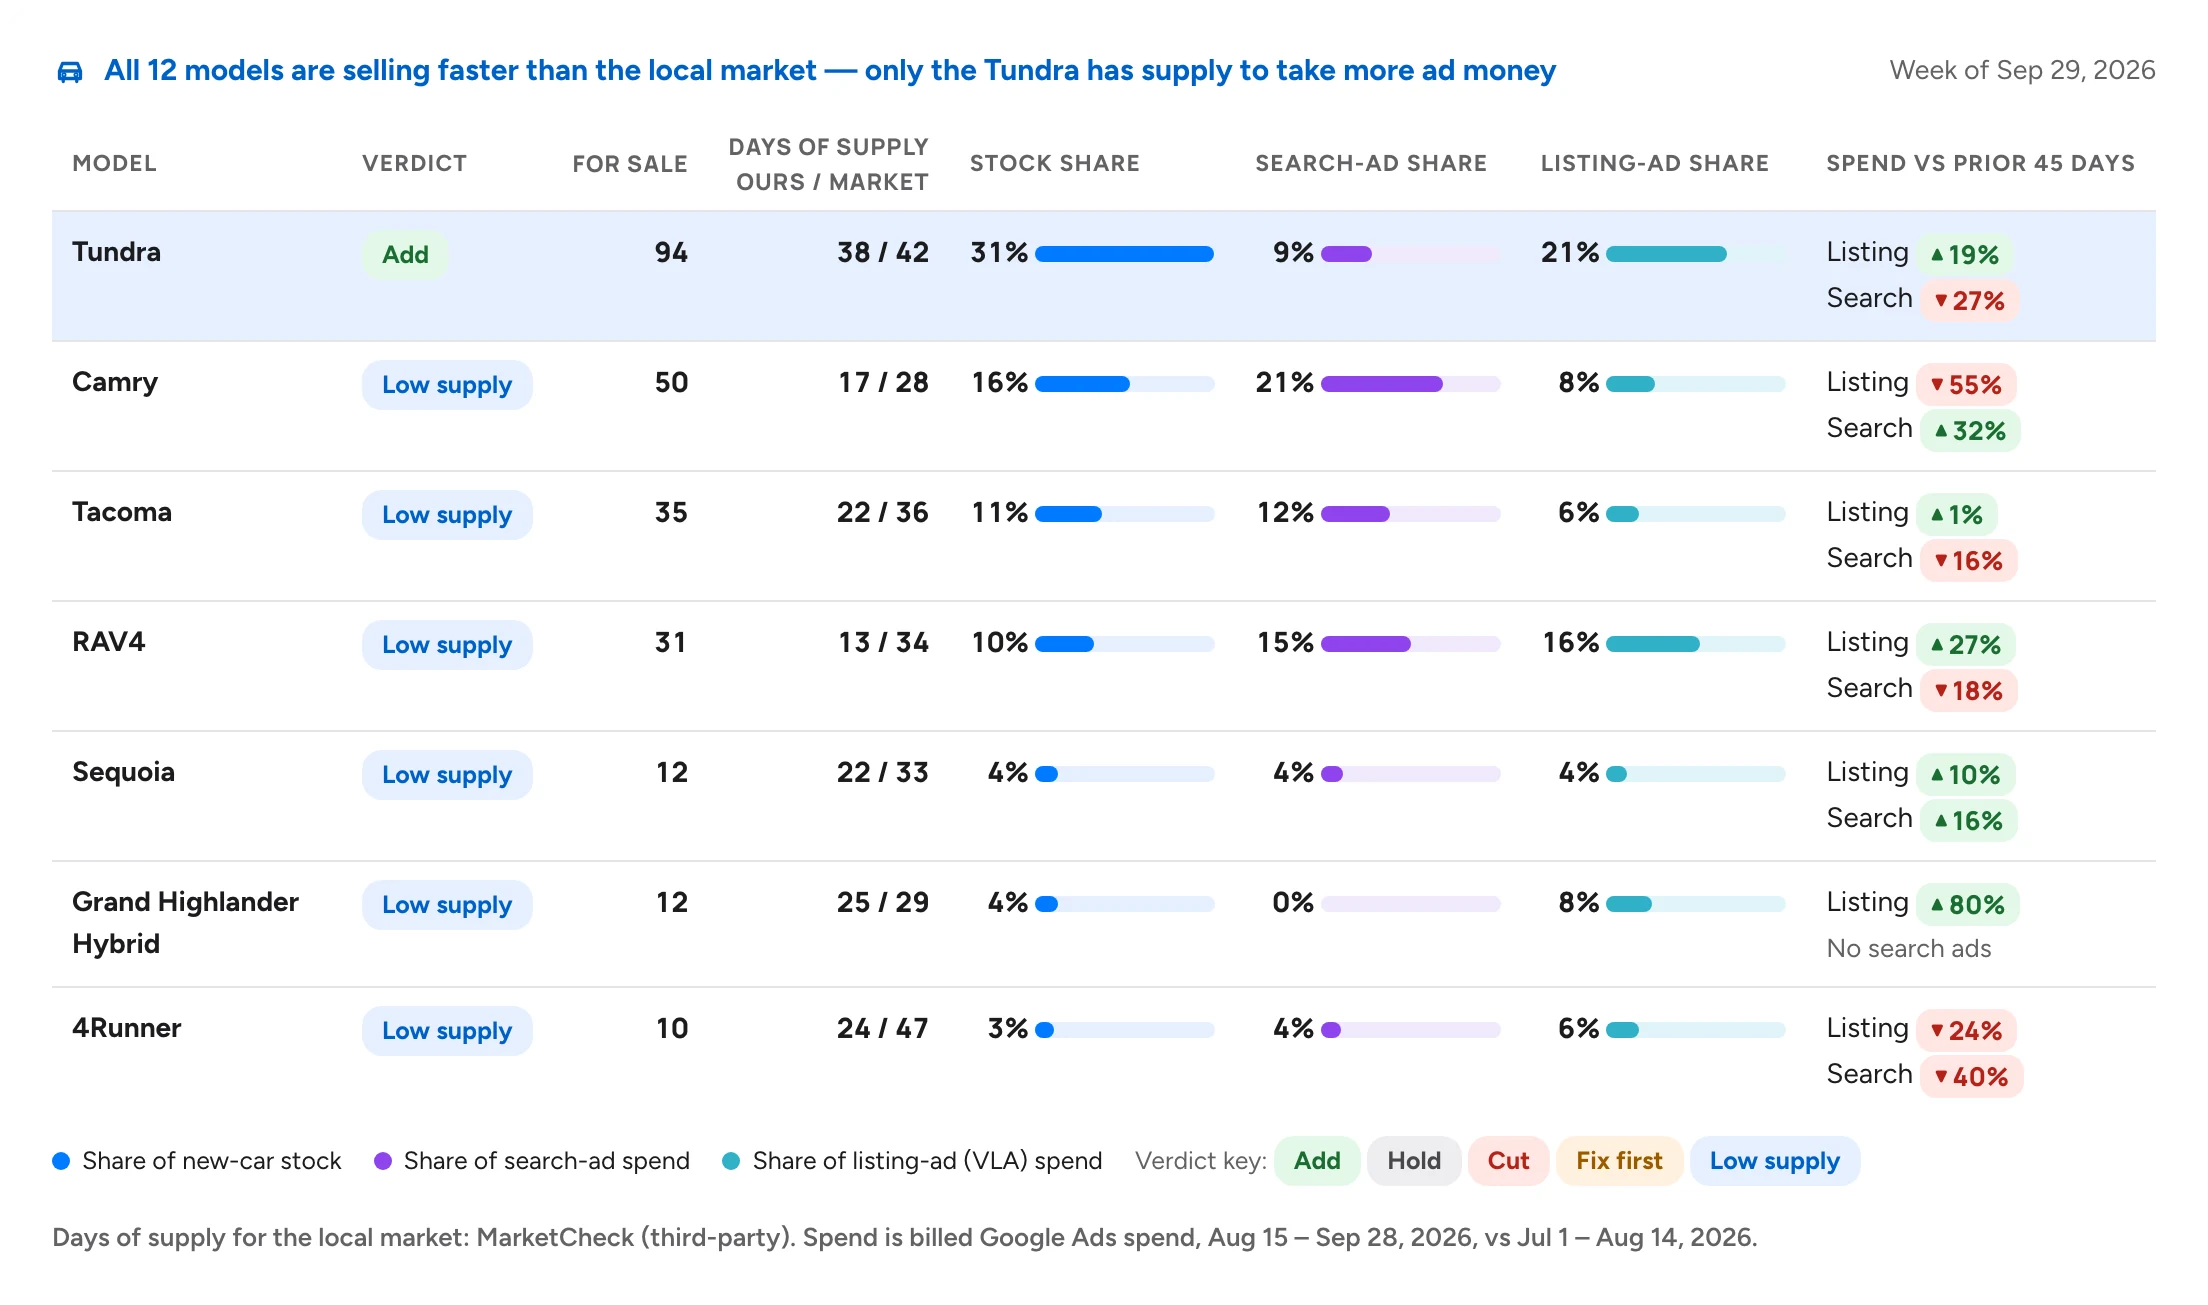
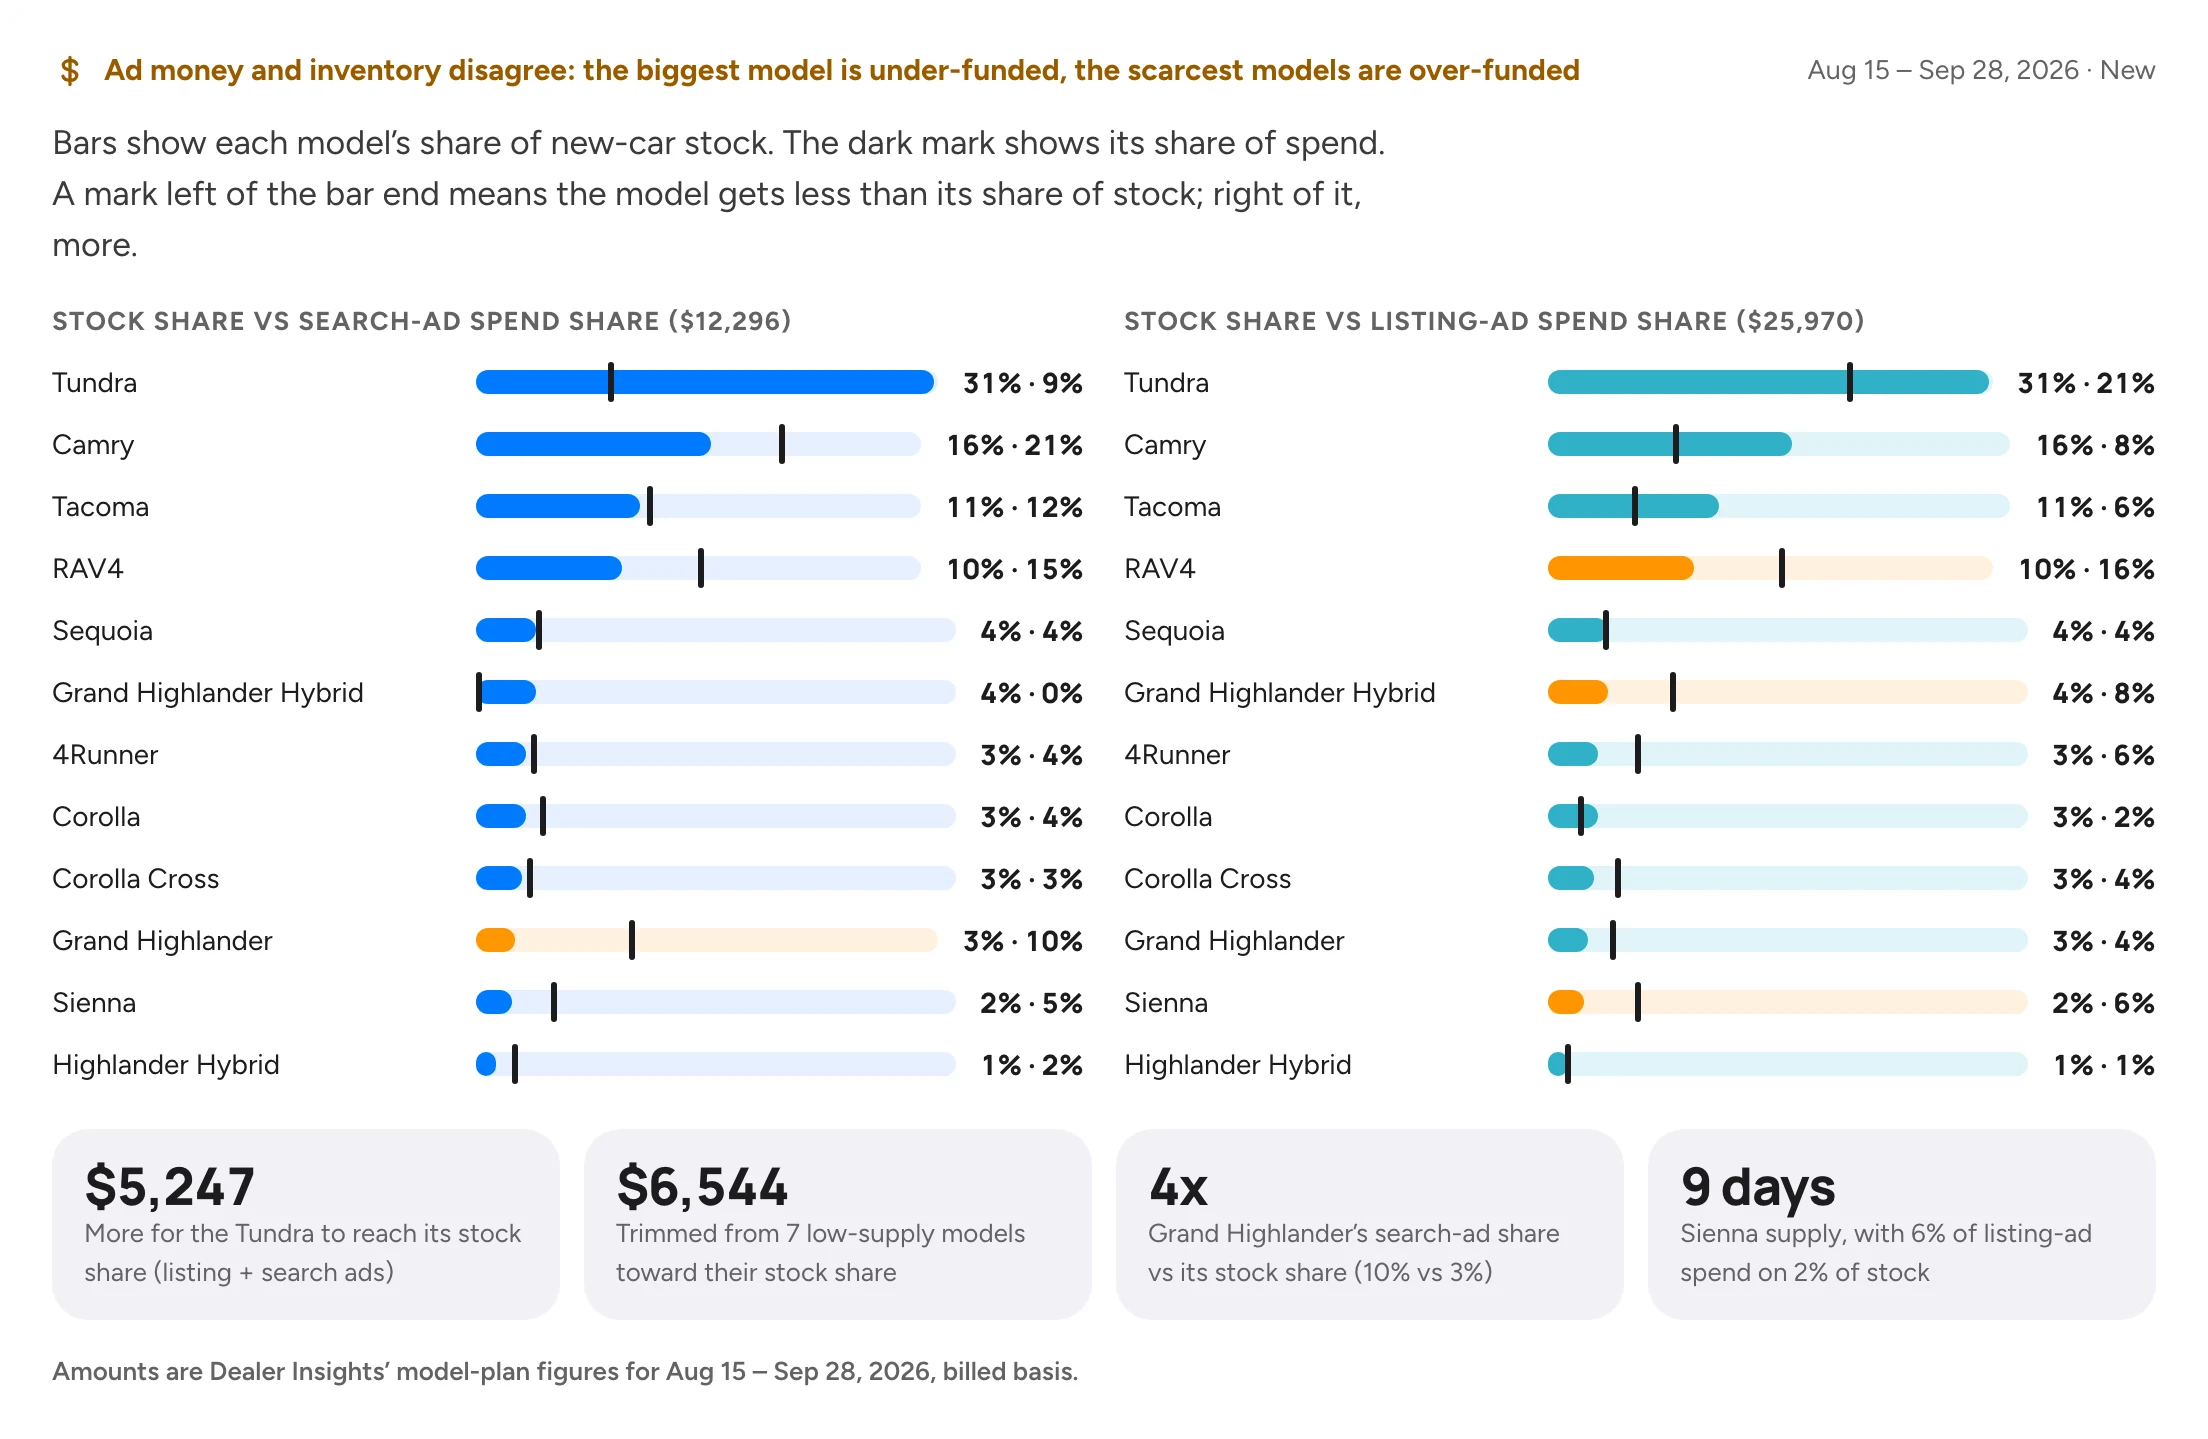
A weekly verdict for every model from Dealer Insights' model plan: supply against the local market, share of the lot against share of the ad budget, and the dollars to move.

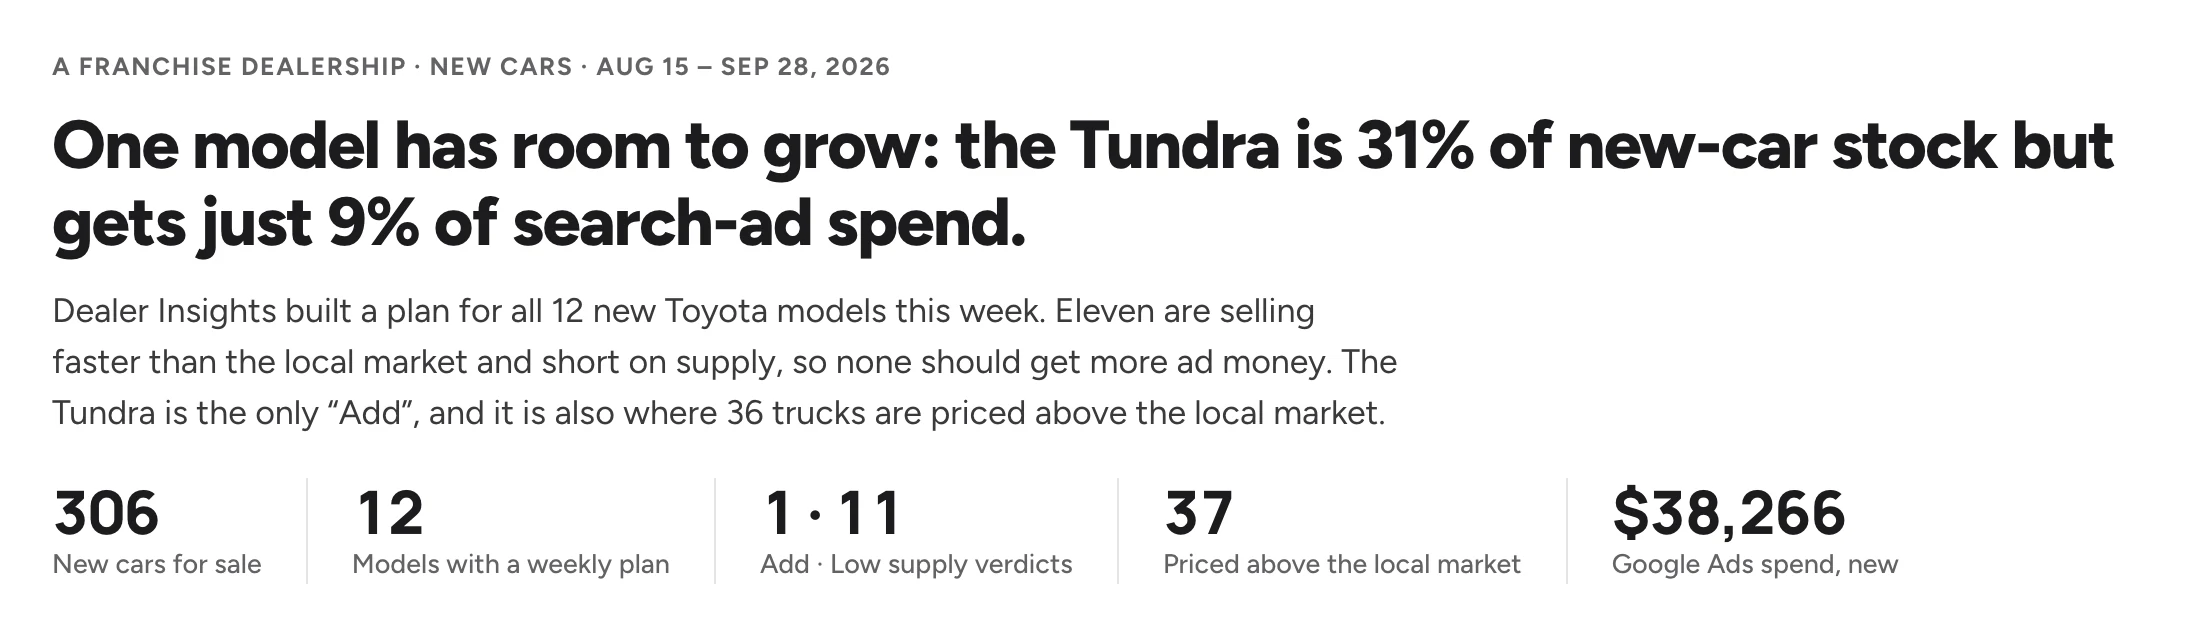
New-car model plan headline: models, verdicts and cars priced above the local market
Weekly verdict for every new model with days of supply, stock share and ad spend share
Stock share versus search-ad and listing-ad spend share for every new model

Question 6 of 8

“Why isn't the truck getting what it deserves?”

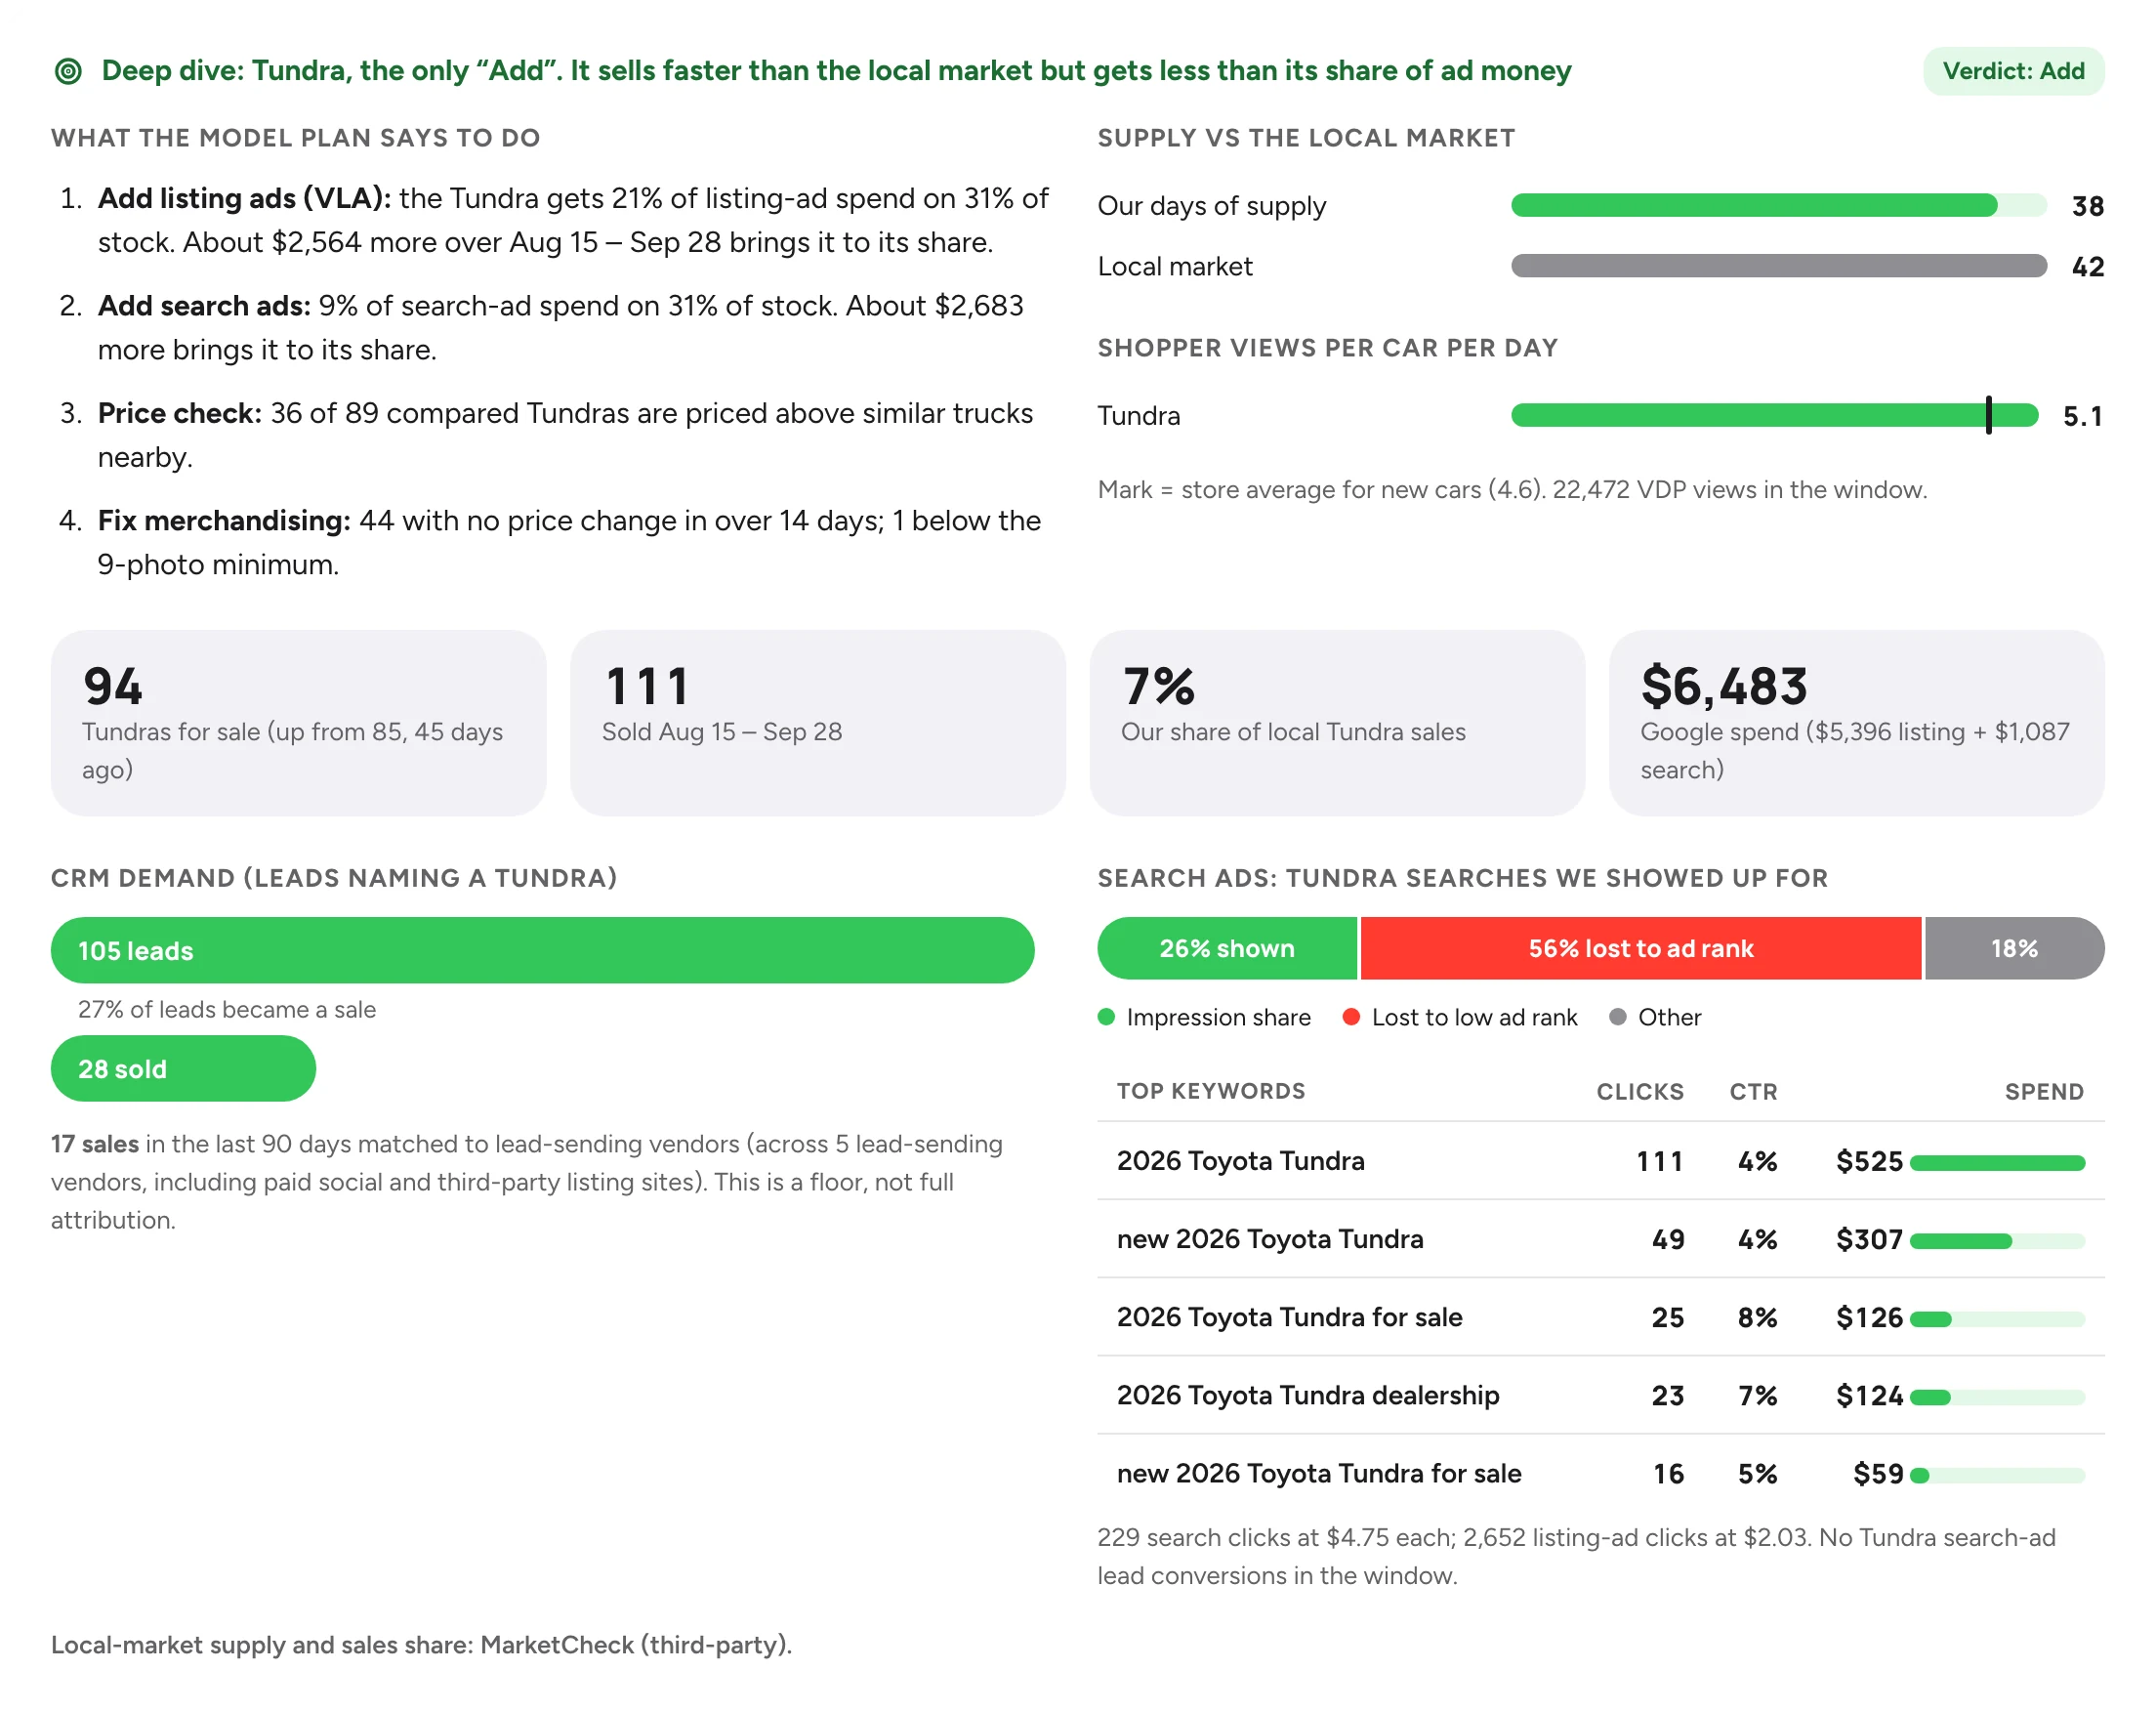
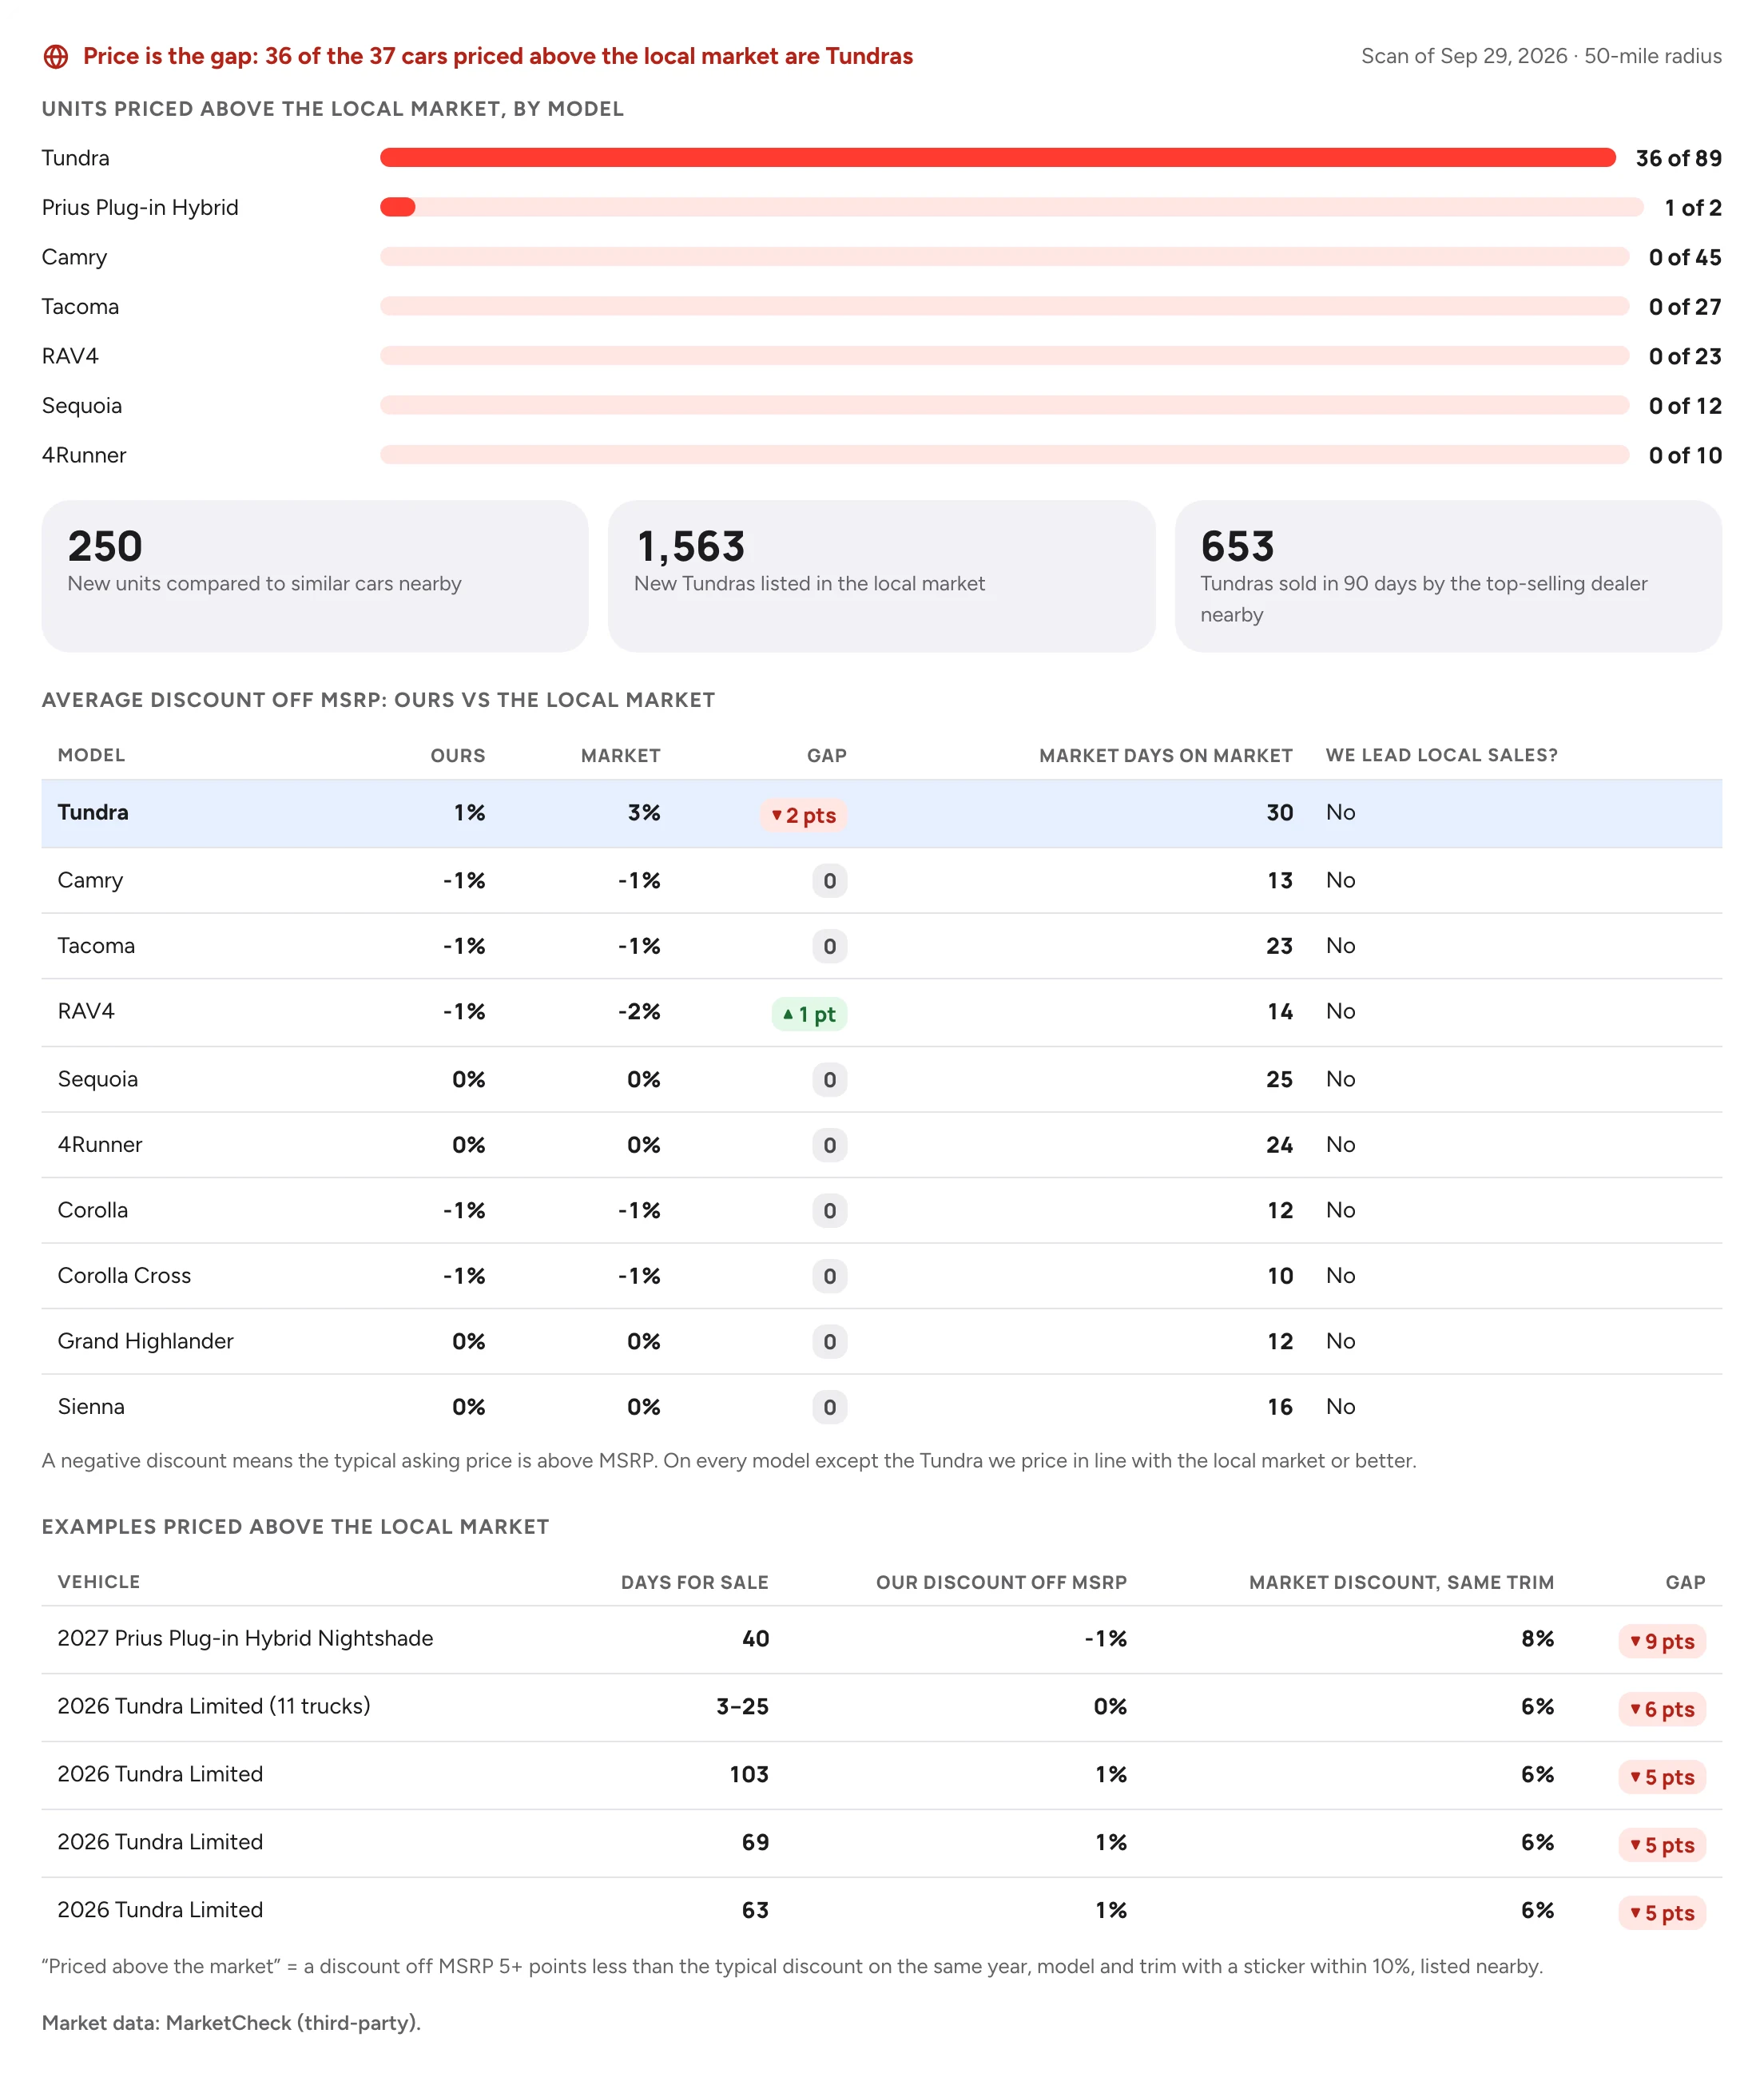
One question about one model: the verdict, the actions, shopper views, CRM demand, the searches it showed up for, and where its price sits against every similar truck within 50 miles.

Deep dive on one truck model: verdict, actions, supply, shopper views, CRM demand and search keywords
Market position: cars priced above the local market by model and discount versus the market
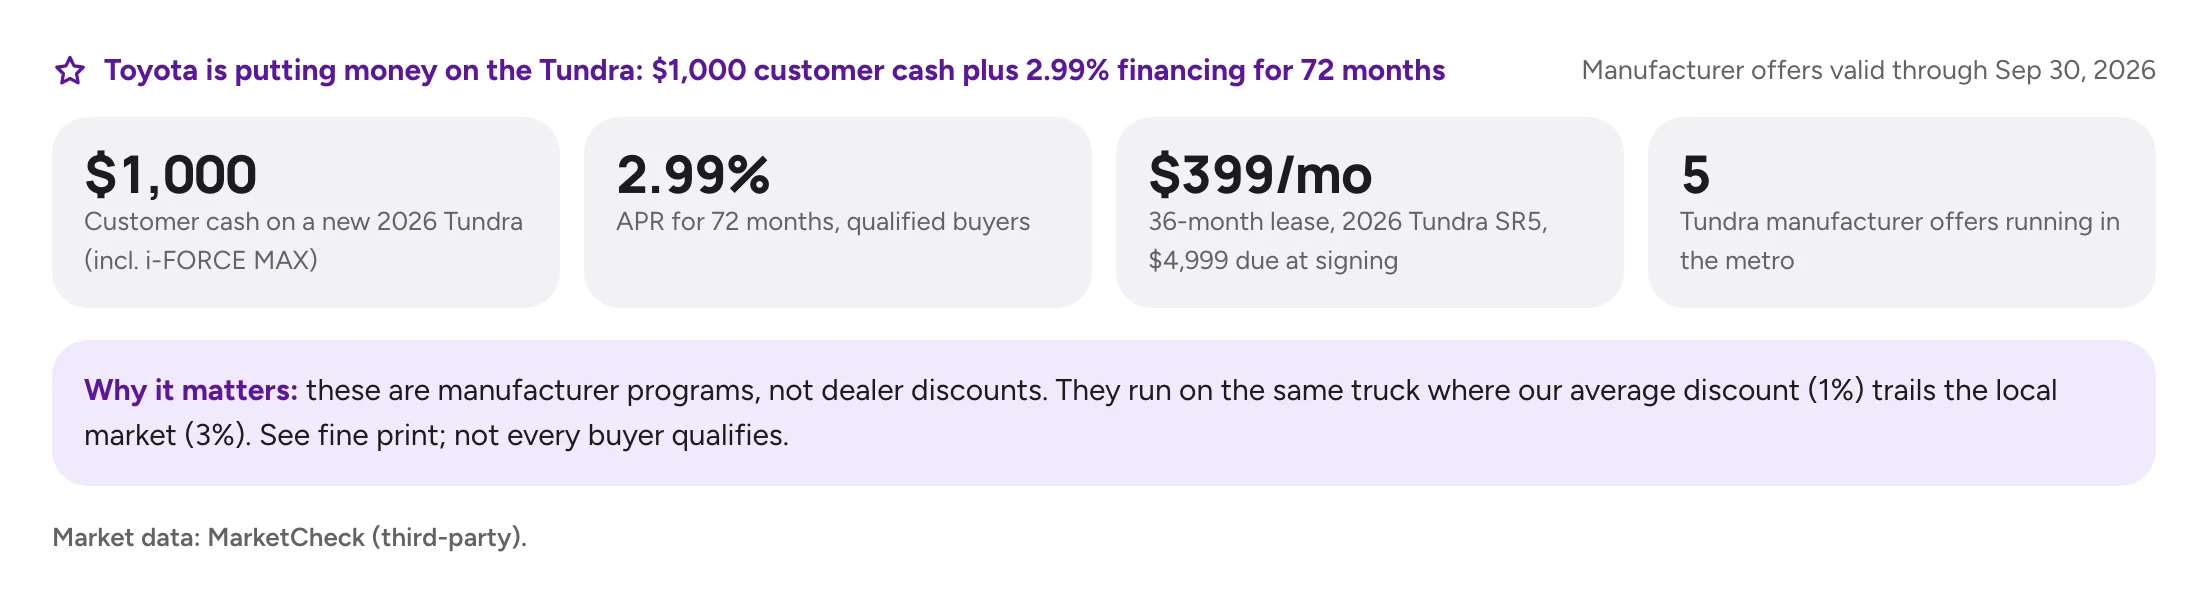
Manufacturer incentives on the model with the biggest price gap

Question 7 of 8

“So what do we do this week?”

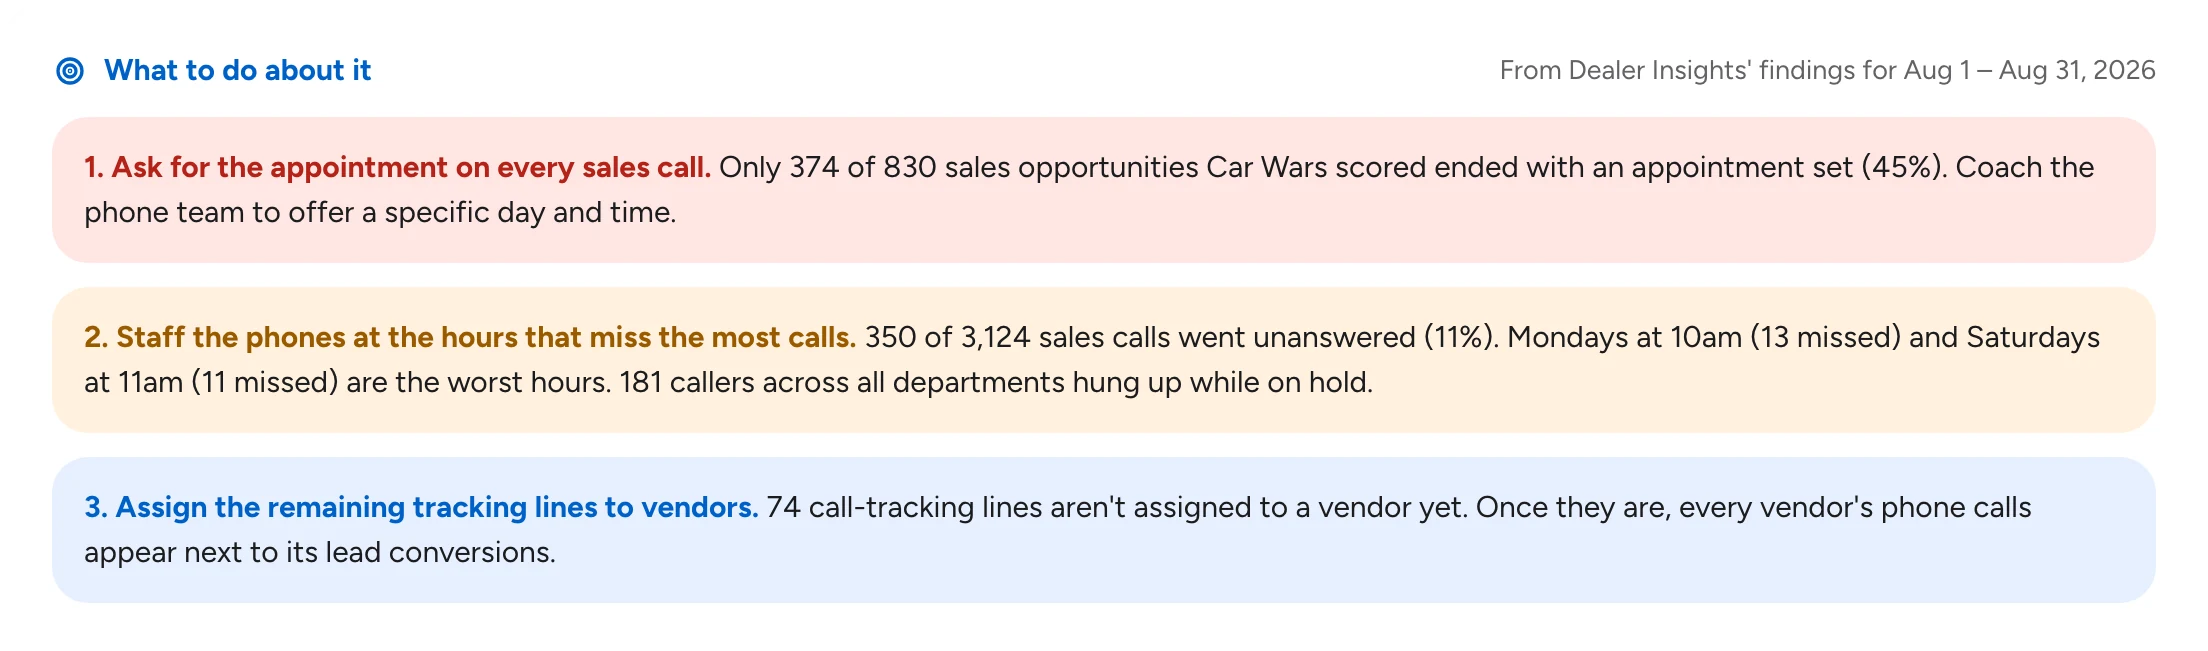
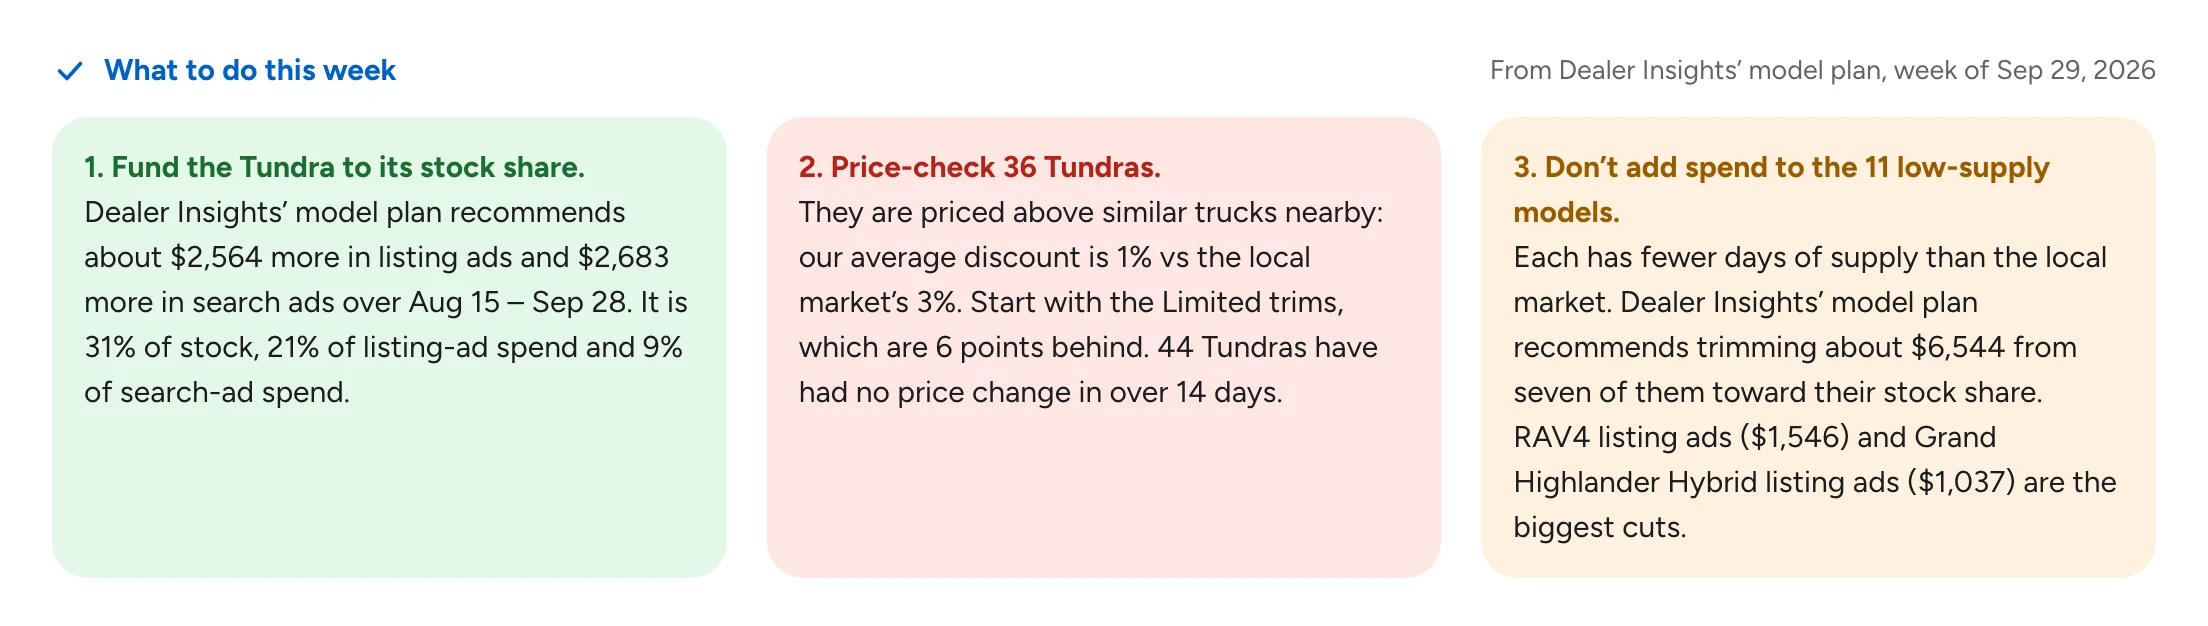
Every report ends the same way: the handful of things to act on, backed by the numbers above. Budget moves come from Dealer Insights' analysis, never from the AI guessing.

What to do about it: three actions from the monthly review
What to do this week: three actions from the model plan

Question 8 of 8 · a second store

“Is anything broken?”

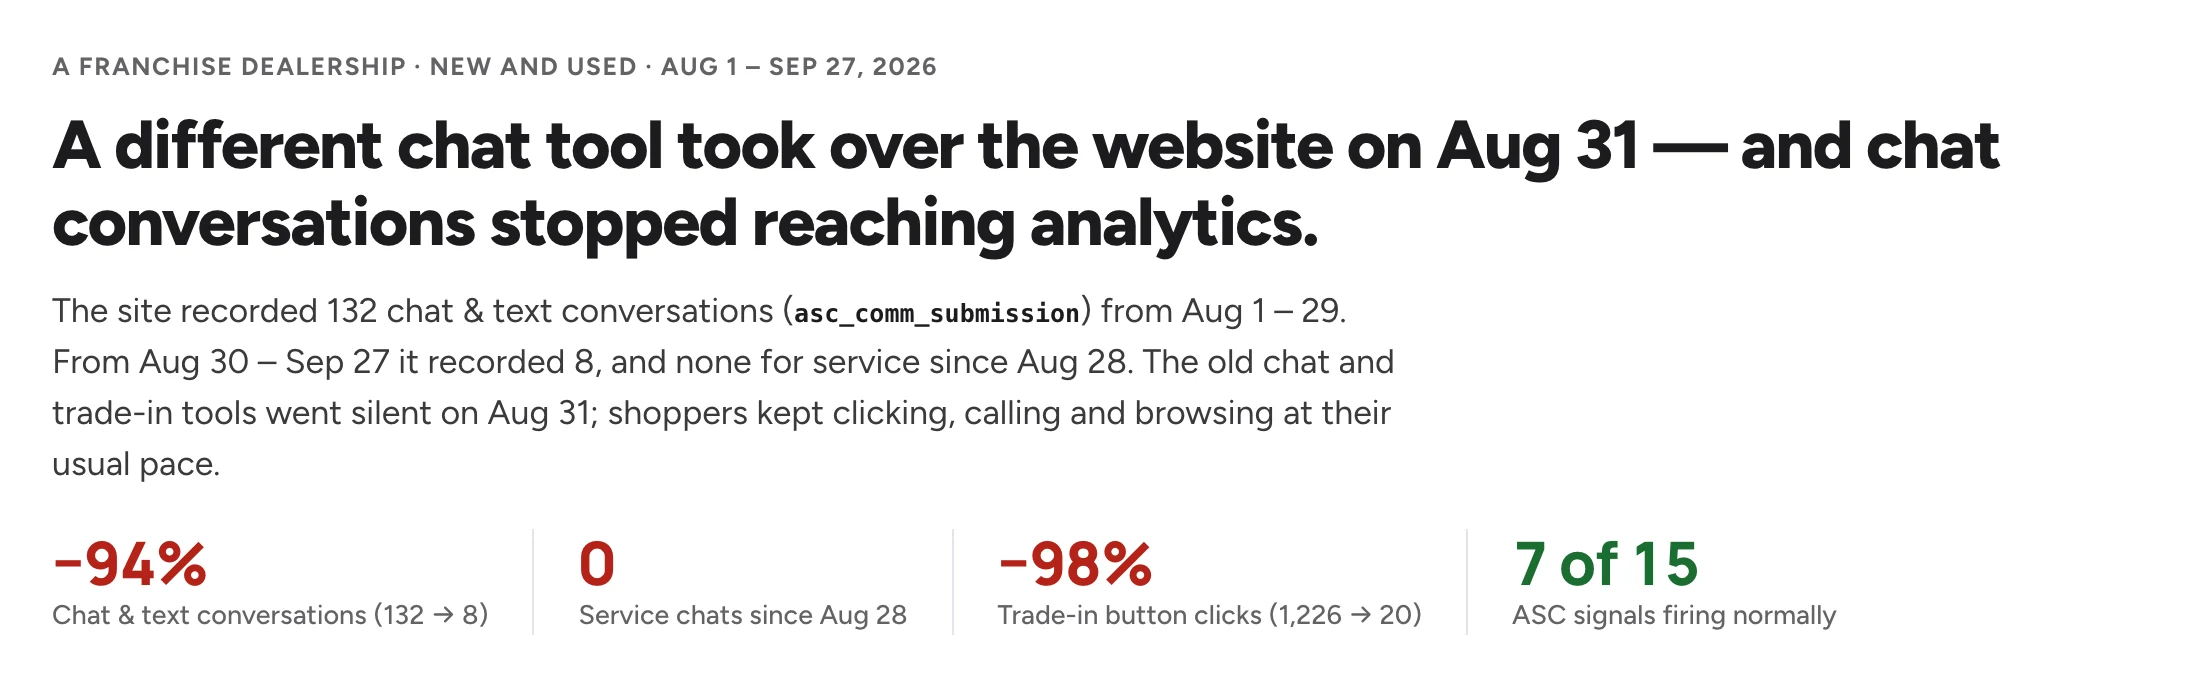
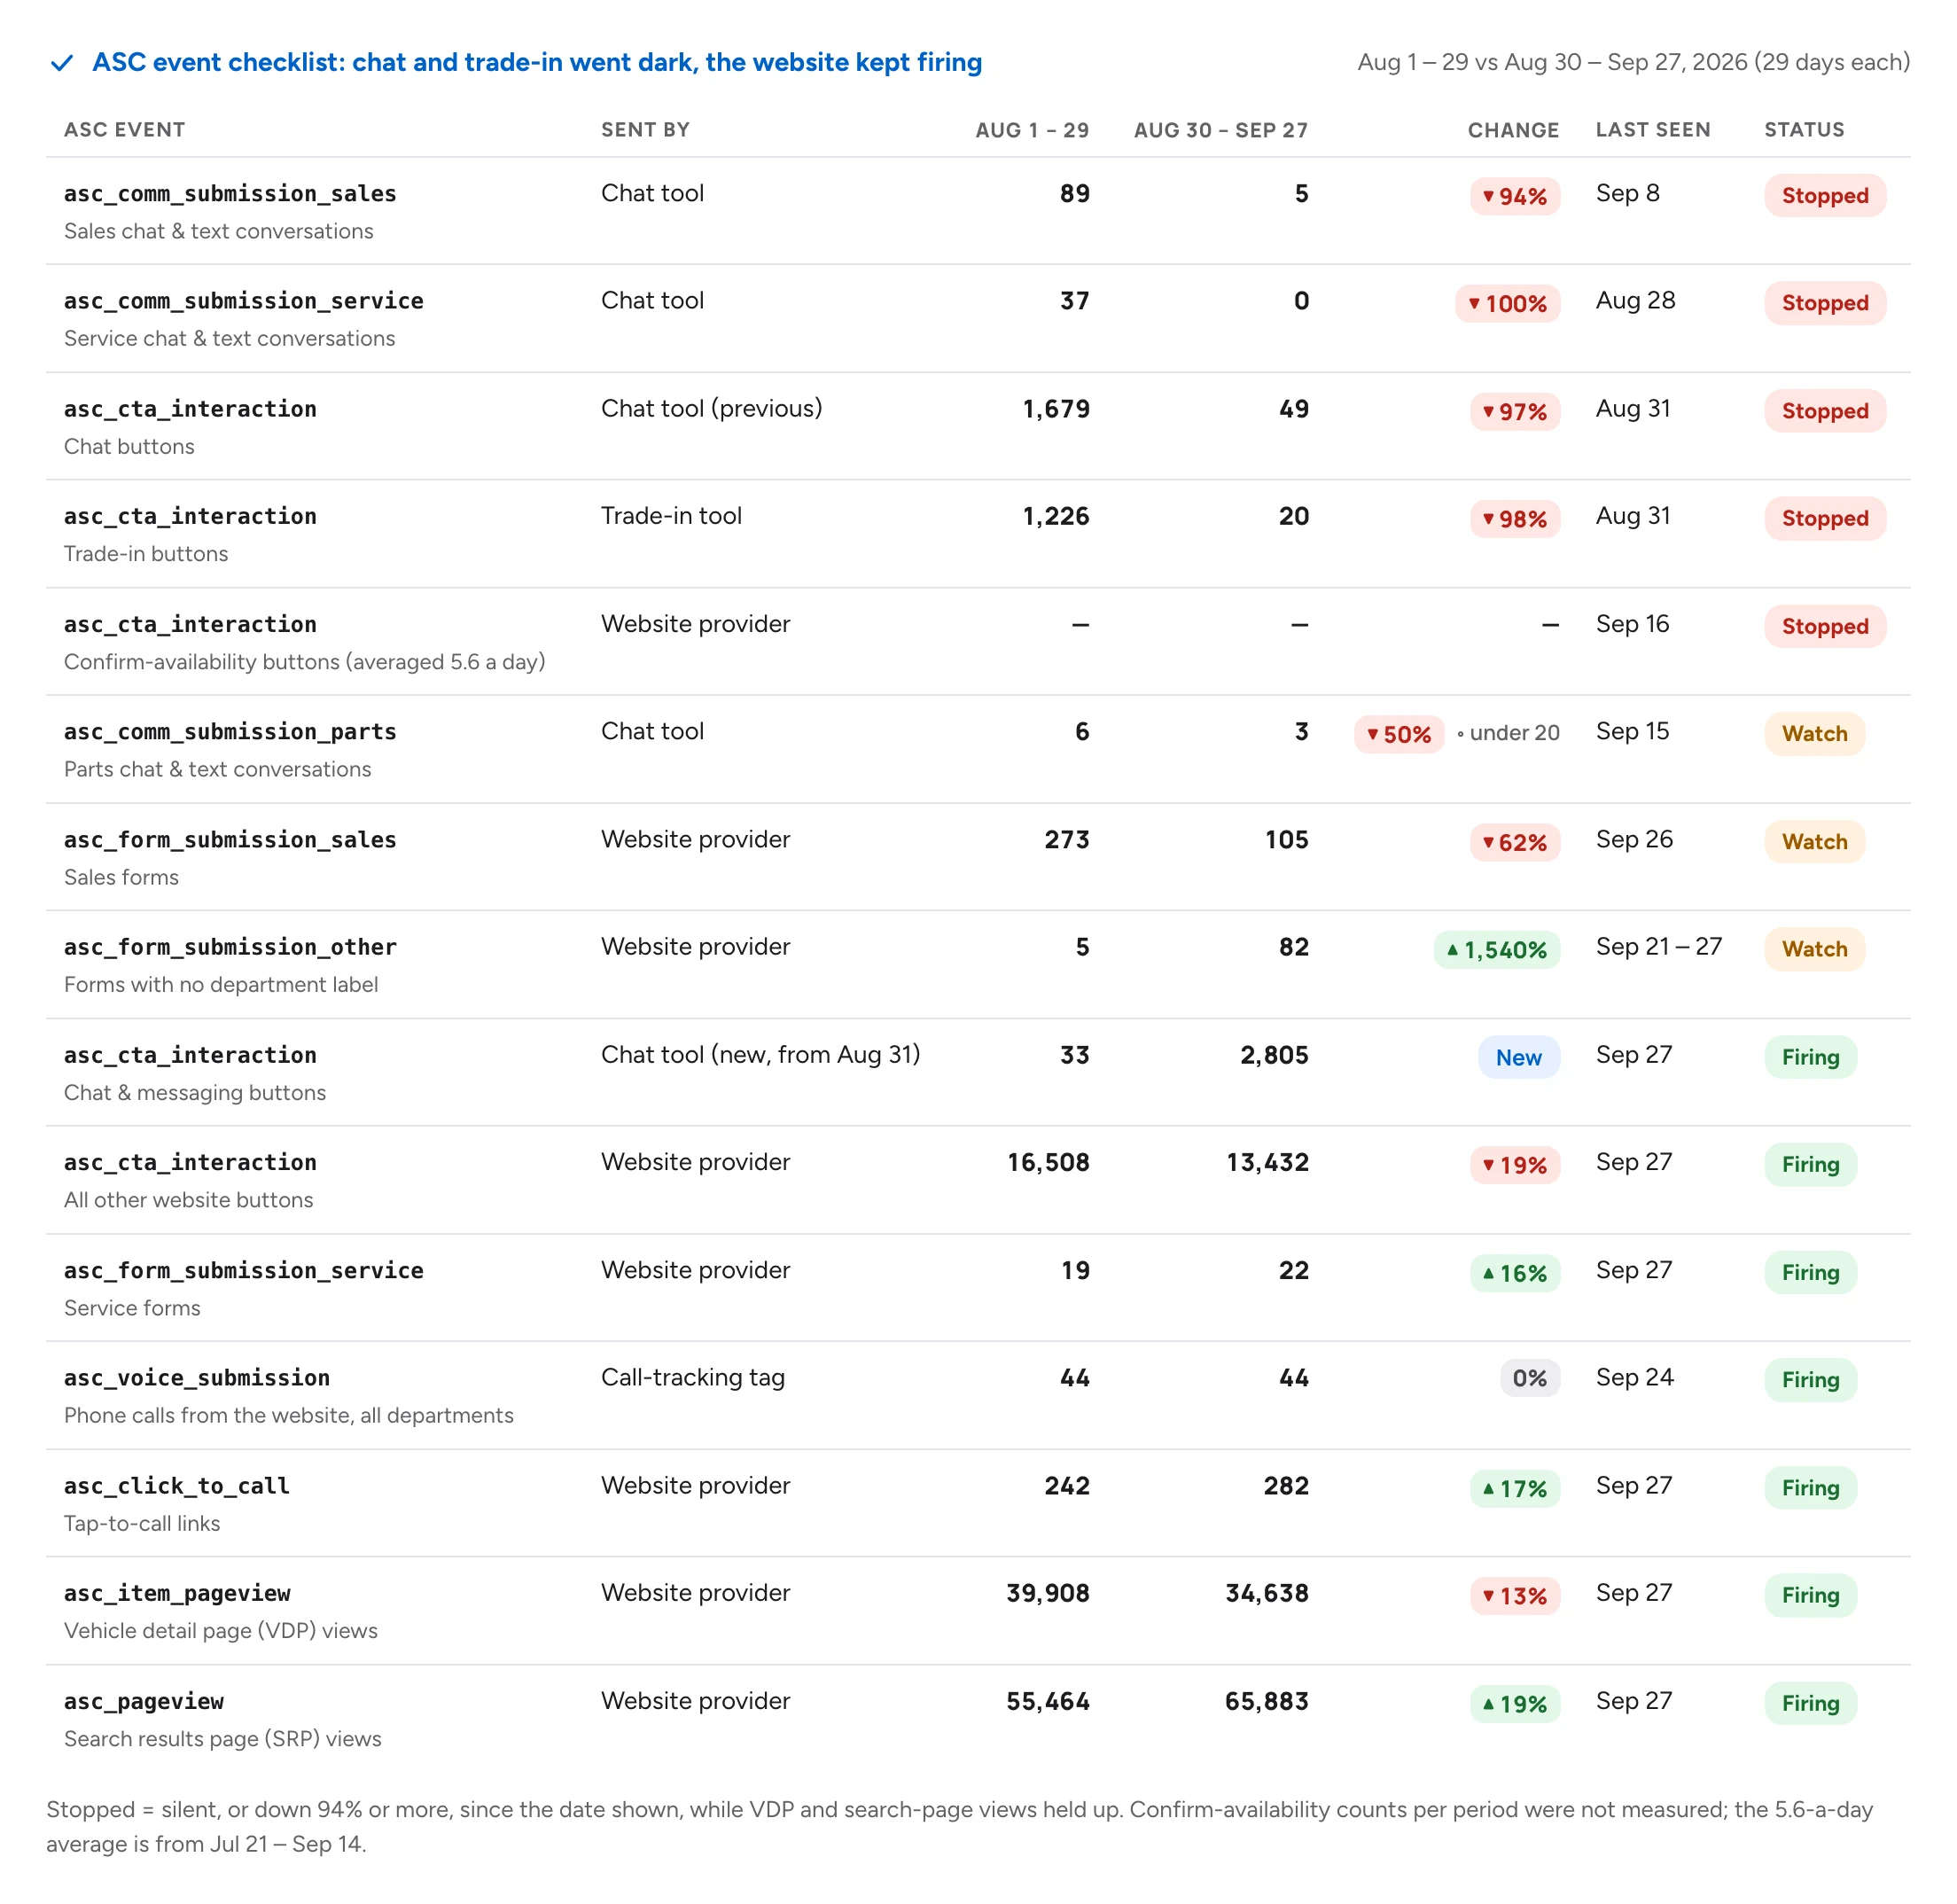
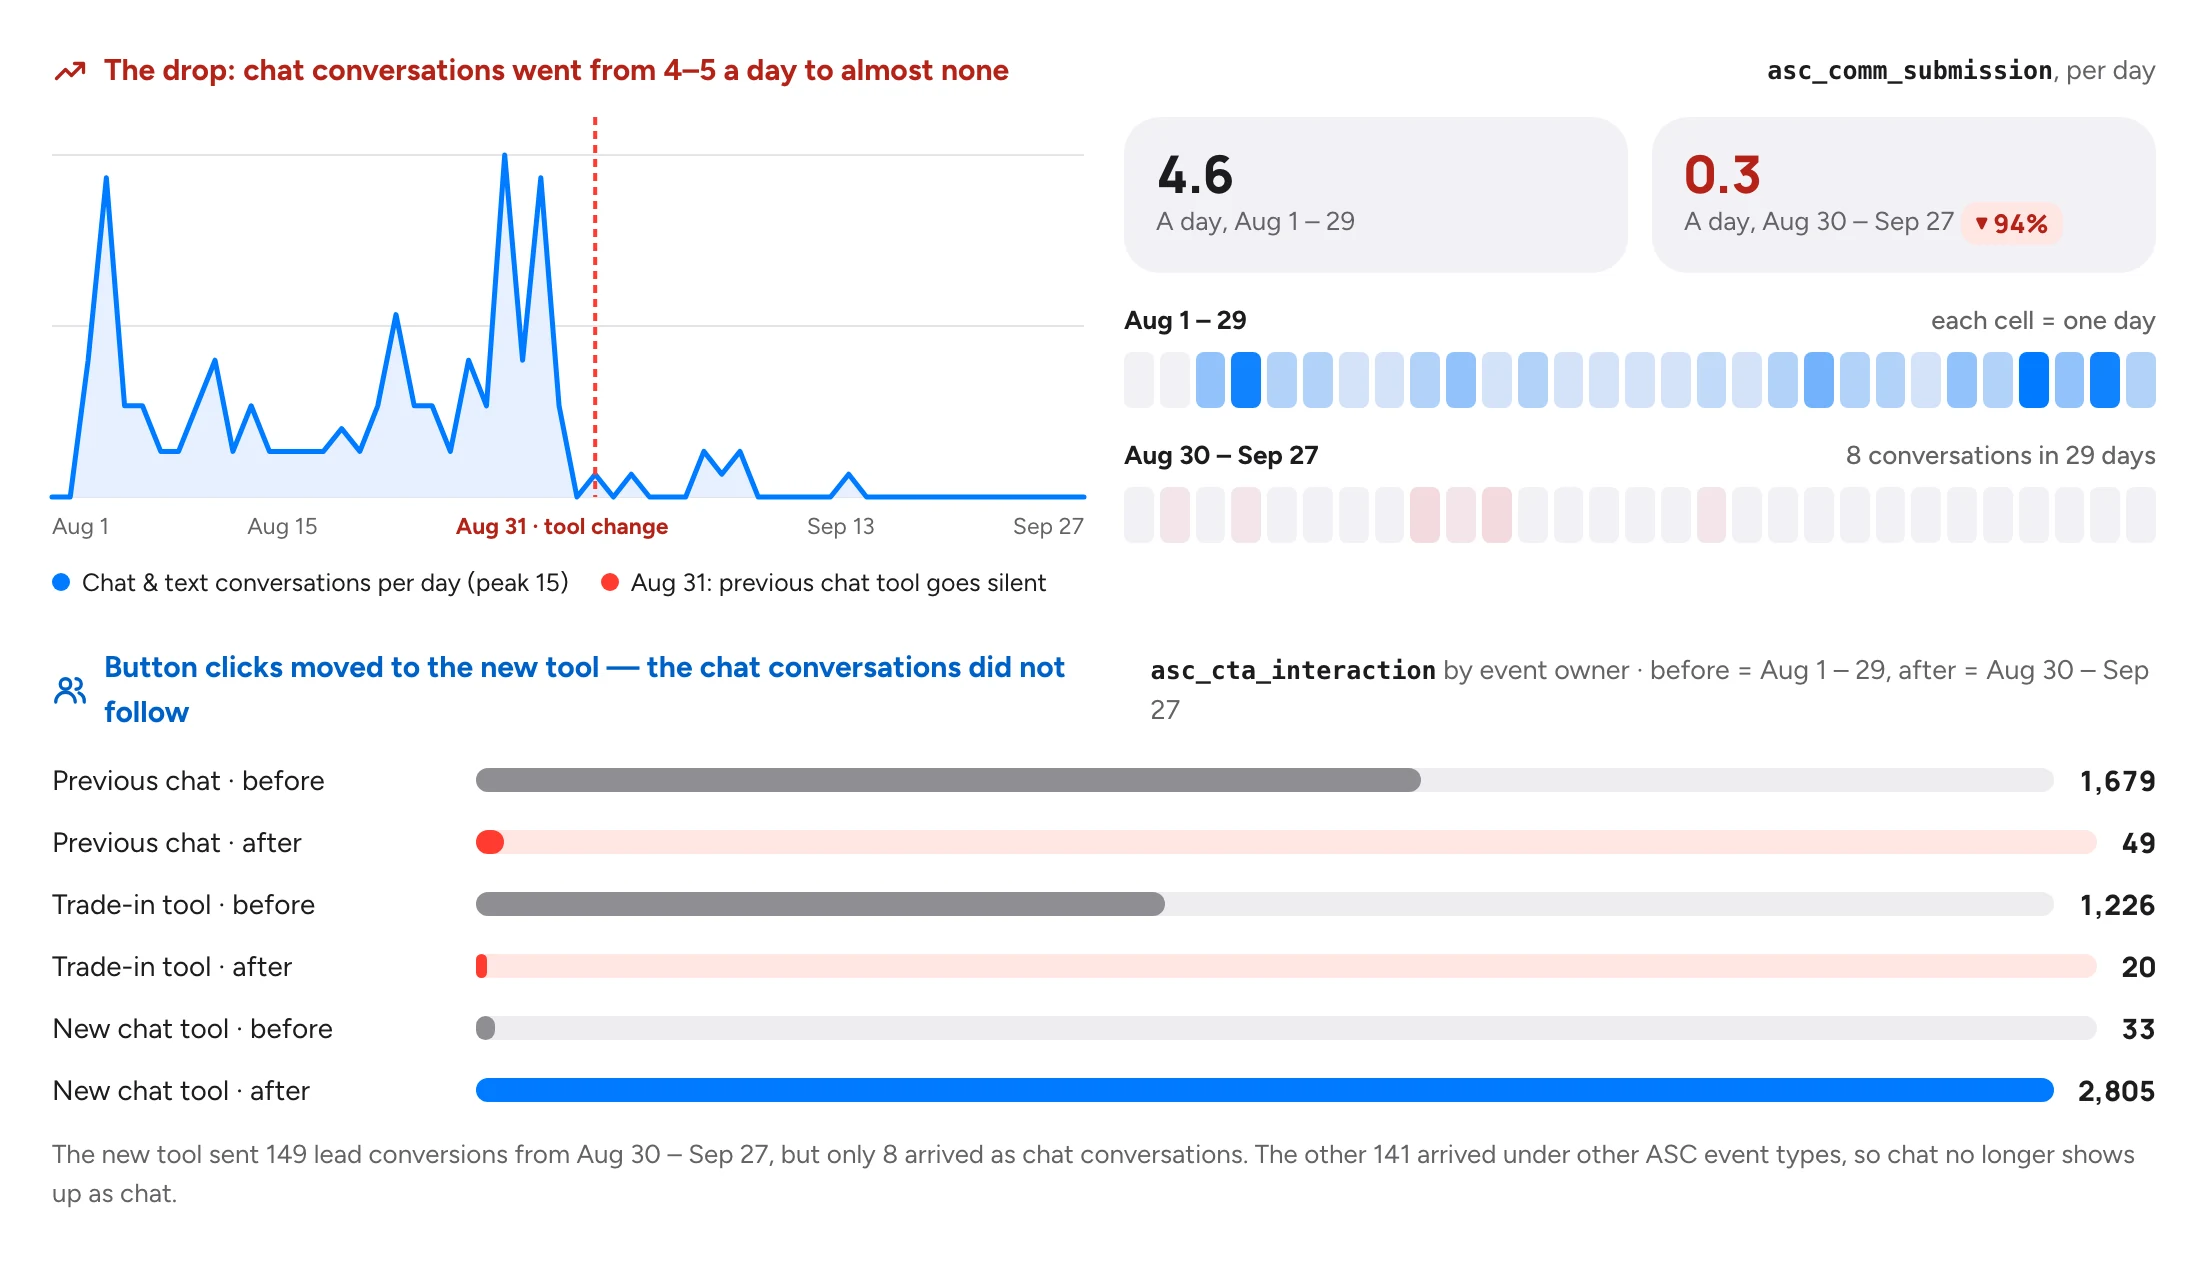
Every number above depends on your website's ASC events firing. At a second store, a chat tool change on Aug 31 quietly cut chat conversations in analytics by 94%. This is the report that caught it, event by event, with who needs to fix what.

Tracking health headline: chat conversations dropped 94% after a website chat tool change
ASC event checklist: each ASC event, the website tool that sends it, volume before and after, last seen date and status
Daily chart of asc_comm_submission chat conversations dropping after Aug 31, and button clicks by website tool before and after

How tracking health works →

Every one of these started as a plain question.

Not a customer yet? The free audit is us asking your store the same questions, live, on your own numbers. You keep the report either way.